Tuesday morning I went back and checked a percentage twice, because it looked like a typo. Anthony Tan, who started Grab in 2012, had bought 10,350,000 shares of it on the open market. His Form 4 recorded the move as a twenty-five-fold increase in his holding. Not because $29.9m is a vast sum against a $13bn company. Because before that trade, the founder and chief executive of Grab directly held 428,498 shares. He had been selling them as recently as August 10th.
So I went back through four years of filings. Somewhere around a year ago, this company's results and its share price stopped agreeing with each other. Ten consecutive quarters of record revenue. Shares down roughly half across those same ten quarters. I had the reason for that wrong until I put both series on one chart.
On September 15th Grab agreed to pay $1.49bn in cash for 60% of Atome Financial, a Southeast Asian consumer lender. Two days later the stock printed $2.74, its lowest level since May 2023. That sequence invites an obvious conclusion: the deal broke the stock. Except the dates won't allow it. This de-rating was already eleven months old. Barclays cut its target from $7.00 to $5.00 on July 9th, two months before anyone outside the deal room had heard of the transaction. On one chart, quarterly revenue and the quarter-end share price separate in autumn 2025. Atome didn't start this. It finished it.
Behind the de-rating: a fuel shock, a strong dollar, and a lending book that consumes capital before it produces earnings. Fuel and the dollar are measurably past their worst. On Grab's own chart, driver incentives per active driver peaked in March 2026 and have fallen since, while the driver count climbed 19% to an all-time high. Mobility took a hundred-basis-point rise in partner incentives and surrendered ten basis points of segment margin.
Hungate bought that Monday too, 299k shares at $2.89, nineteen days after selling 145k at $3.48. He bought back more than twice what he had just sold, at a lower price. And insider purchases at Grab had been a flat line for twelve straight quarters before that week.
None of that makes the position easy. Three times this year the stock has rallied and three times it has made a lower high. Financial Services still loses money, the Atome returns were declined in public, and competition in regional lending is real enough to carry a section of its own further down. Being right about the business hasn't yet been the same as being right about the price. I can't promise this is the time it works either. What I can do is show why September's break marked the whole company down to what one of its businesses is worth on its own, and where the evidence says that stops.
Ian Andy, Research Desk, Bellwether Research, September 25th, 2026
Year Nobody Dated Correctly
Ten bars, one line, and a date where they stop agreeing.
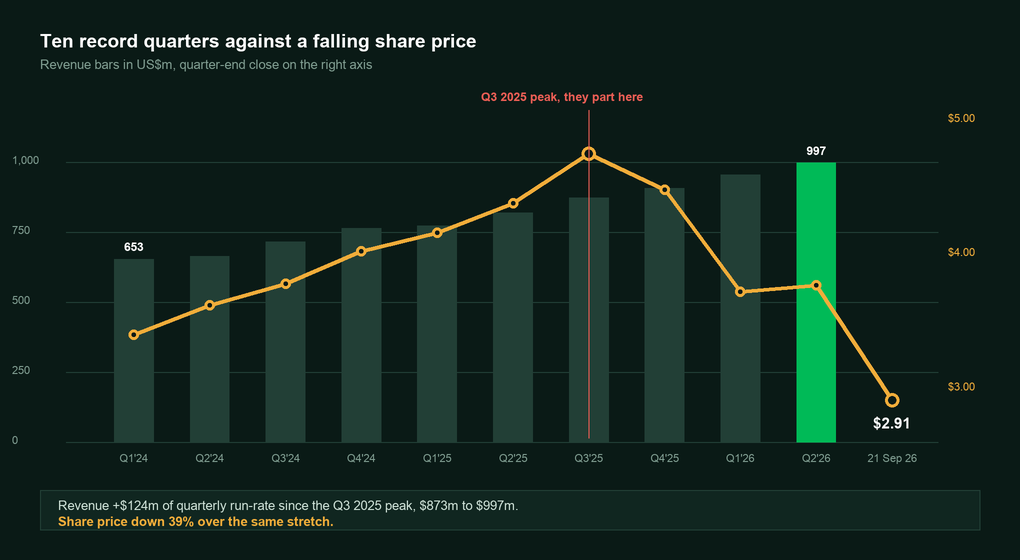
Q2 2026, reported on August 3rd, was the tenth of those record quarters. On-demand gross merchandise value reached $6.46bn, up 21% year on year. Revenue of $997m grew 22%. Adjusted EBITDA of $168m grew 54%, lifting margin from 13.3% of revenue to 16.9%. Eighteenth consecutive quarter of adjusted EBITDA growth. Management raised full-year guidance twice in a row: revenue to $4.10-$4.15bn and adjusted EBITDA to $720-$740m, where a new floor clears the old ceiling.
Guidance raises don't usually precede three-year lows. Whether the business works is settled by the filings. What the market decided to pay for a business that works this way is the open question, and every section below is an attempt to answer it.
Closures of the Strait of Hormuz pushed energy prices up from late 2025, across a region that draws roughly 35% of its oil through it. Higher US rates followed, the dollar strengthened, and ASEAN currencies weakened against it, which Grab now books as a 2-3% headwind inside its own guidance. And the lending book began to scale. Expected credit losses land at origination; revenue from those same loans arrives across their life. Grow a loan book fast and the cash flow gets worse at exactly the moment it's working.
Adjusted free cash flow fell 35% year on year in Q2, from $112m to $73m, in a quarter when adjusted EBITDA rose 54%. Part of that is a definitional change Grab made in Q2 2026 to how loan working capital is treated, so the comparison is less clean than it looks. Most of it is cash leaving to write new loans, with the repayments arriving over the months that follow. I'd rather say that here than have it turn up later as a surprise.
What This Company Now Owns
Grab reports four segments across eight Southeast Asian countries and more than 900 cities, with over 12,000 employees and 53.9 million monthly transacting users. Mobility, Deliveries and Financial Services carry the business, with a small Others line alongside. Describing it as a ride-hailing company stopped being accurate several years ago.
Money arrives along a different cut than those segment lines. Almost everything below depends on keeping the two apart. On-demand earns a commission on gross merchandise value. A rider pays a fare, a diner pays for a meal. Full amount is GMV. Grab keeps a slice; the rest goes to the driver or merchant. That slice is the take rate. In Q2 it ran 14.9% in Mobility and 12.5% in Deliveries, a blended 13.3% across on-demand. Financial Services earns something different: an interest spread between what borrowers pay and what Grab pays for the deposits and wholesale funding behind the loan. Advertising, sold to merchants already on the platform, is the third and highest-margin line, booked inside the on-demand segments rather than split out.
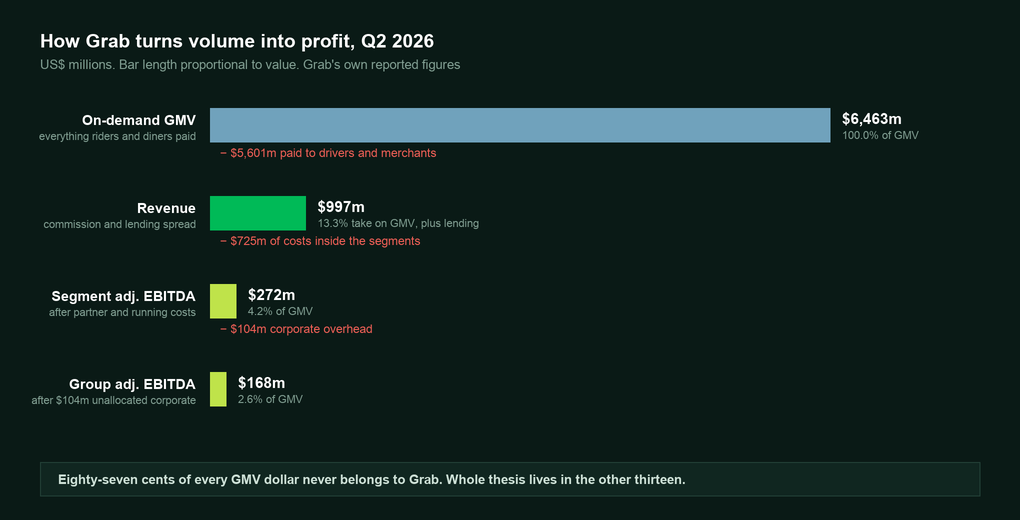
Which explains a reporting convention that otherwise looks arbitrary. On-demand margins are quoted against GMV because GMV is the volume the take rate is levied on. Financial Services margins are quoted against revenue because a loan book has no GMV. Comparing the two directly gets you nowhere. I keep them separate throughout.
Mobility is the profit engine. Q2 revenue of $331m on $2.21bn of GMV produced $191m of segment adjusted EBITDA, a margin of 8.6% of GMV against a stated 8.5-9.0% range. Deliveries is the scale engine: $531m of revenue on $4.25bn of GMV, $96m of segment EBITDA, a margin of 2.3% of GMV against management's own 4% steady-state target. Financial Services is the contested one: $134m of revenue, growing 59%, still losing $15m at the segment line.
| Segment | Revenue | GMV | Segment adj. EBITDA | Margin | Year ago |
|---|---|---|---|---|---|
| Mobility | $331m | $2,214m | $191m | 8.6% of GMV | 8.7% |
| Deliveries | $531m | $4,249m | $96m | 2.3% of GMV | 1.8% |
| Financial Services | $134m | GLP $2,318m | ($15m) | -11.2% of rev | -30.3% |
| Total segment | $997m | - | $272m | - | $201m |
Note the gap between $272m of total segment adjusted EBITDA and the $168m reported at group level. Roughly $104m a quarter of unallocated corporate cost falls between them, about $416m a year. Capitalise segment EBITDA without subtracting that and your sum-of-the-parts comes out far too high. I carry it as a line of its own in section 10.
Nine months have redrawn the perimeter of this company. Superbank, an Indonesian digital bank, was consolidated in May; Stash, a profitable wealth platform with $5.5bn of assets, completed in July; Foodpanda Taiwan agreed with Delivery Hero for $600m; then September, and $1.49bn for 60% of Atome. All but one are financial businesses, and that's where most of this study goes. Mobility gets less room here than its profit share probably deserves, because the argument and the risk both live on the lending side.
Monthly transacting users grew 17% while GMV per user grew only 3%, so growth is arriving as more users and more transactions rather than higher prices. And GrabMart, its grocery business, grew transactions 54% and users 42%, meaning frequency per user rose as well. Grocery reaches 14% of the food user base today. Management pointed at peers above 30% as the reference. Close that gap and deliveries finally has the volume to grow into the 4% margin target section 08 builds on.
Fuel Shock Already Past Its Peak
Buried in Grab's own deck is a chart that undercuts much of the bear case on its cost base. Nobody on the call mentioned it.
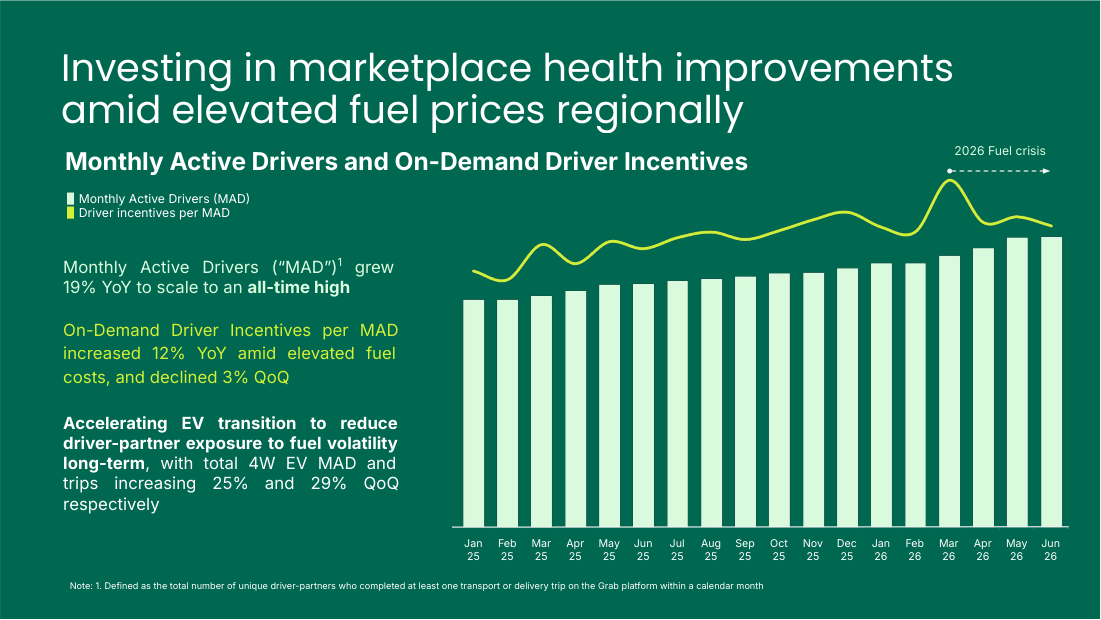
Numbers underneath that picture - monthly active drivers up 19% year on year to a record, driver earnings up 4%, and a $7m targeted support programme running since March. Incentives per active driver rose 12% year on year but fell 3% sequentially. Alex Hungate was direct on the Q2 call, saying Grab would keep supporting drivers "no matter what happens" with fuel, and confirming mobility margins would hold inside 8.5-9.0% through the second half regardless.
Against that, what the incentive line actually cost. Total on-demand incentives ran 10.9% of GMV in Q2 2026 against 10.1% a year earlier, with mobility partner incentives alone climbing from 4.7% to 5.7% of segment GMV. So Grab absorbed a full percentage point of extra subsidy and gave up a tenth of a point of segment margin doing it. That is money spent on purpose. It bought supply.
So was fuel ever structural? It was a real cost and a real reason to mark the shares down. But the cost peaks and decays while what it bought, a record driver count, stays on the platform. That reads as a timing problem rather than a structural one. Either way, the quarter reported on November 17th settles it.
Mobility revenue of $331m in Q2 was lower than the $337m it printed in Q1. First sequential decline in thirteen quarters. GMV grew 18% and transactions grew 28% while revenue grew only 12%. Arithmetically that can only happen if the take rate falls. It did, from 15.7% of mobility GMV a year ago to 14.9%, a deliberate 72 basis points given away to saver fares and driver support. Management chose that trade deliberately. It still lands as a falling revenue line, worth knowing before the next print rather than after.
Indonesia Cap, Measured Properly
In May 2026 a presidential regulation in Indonesia cut the maximum commission a ride-hailing platform may charge a driver from 20% to 8%. Indonesia is Grab's largest market. Sized against group revenue the damage looks severe. Indonesia contributes roughly a quarter of the top line. An 8% ceiling more than halves commission headroom.
That arithmetic goes wrong on scope, in two checkable places.
Hungate stated it on the August call - the two-wheel taxi business, Ojol, "represents 6% of our total mobility GMV, so relatively small," and full-year guidance "does assume that the commission structure remains as currently implemented for Ojol only." Realised margin agrees: mobility ran 8.6% of GMV in Q2 against 8.7% a year earlier, after the regulation was signed and while fuel was still elevated.
So where is the actual risk? Implementation landed in July, so Q2 captured only part of it and the clean test is Q3. Asked directly whether the cap could spread to four-wheel vehicles or deliveries, Hungate offered only that Grab has "no information to suggest that anything otherwise will occur." That is an absence of evidence, not a commitment. If that scope ever widens, it is the one regulatory event that does real damage to the mobility profit pool.
Two-wheel rides run on different economics. Anthony Tan noted on that call that more than half of all transactions in Southeast Asia are two-wheel, priced below one dollar per ride. That is why he regards autonomous vehicles as uneconomic for regional rollout today, and why Grab's Singapore pilot, a WeRide-powered Ai.R shuttle that has carried over 9,000 riders since January, is a small deliberate experiment rather than a strategy. Anyone underwriting Grab as an autonomy story is underwriting the wrong company. That cuts both ways - the autonomy disruption risk priced into Western mobility peers barely reaches this region.
Important Disclaimer
This content is for informational and educational purposes only and does not constitute financial advice, investment recommendations, or solicitation to buy or sell any securities. Past performance does not guarantee future results. All investments carry risk, including the possible loss of principal. Shares of Grab Holdings Limited (NASDAQ: GRAB) are subject to significant risks including: a proposed $1.49 billion cash acquisition of a 60% interest in Atome Financial that is not expected to complete until the third quarter of 2027, remains subject to regulatory approval, and whose target's return on equity, portfolio yields and cost of credit have not been disclosed; a second-tranche earn-out for the remaining 40% of Atome Financial priced on a formula subject to a floor of $2.0 billion and a cap of $4.5 billion, creating a contingent cash obligation materially above the per-unit price paid in the first tranche; consumer and driver lending portfolios whose credit performance is sensitive to Southeast Asian employment, inflation and interest-rate conditions and which are reported on a gross basis before expected credit loss allowances; a gross loan portfolio that grew 197% year on year and a funding structure that relies on digital-bank deposits, third-party financing partners and warehouse facilities; regulatory intervention in ride-hailing commissions, including an Indonesian presidential regulation capping two-wheel commissions at 8% and the risk that similar caps are extended to four-wheel or delivery services or adopted in other markets; elevated and volatile regional fuel prices arising from disruption to the Strait of Hormuz, and associated US dollar strength that produces a 2-3% translation headwind to reported results; a proposed acquisition of Foodpanda Taiwan under review by the Taiwan Fair Trade Commission which may not complete; competition from Sea Limited, GoTo, TikTok Shop, Bolt, LINE MAN and others, including a financial-services competitor materially larger and more profitable than Grab's own; Uber Technologies' approximately 13.5% economic interest and its pending acquisition of Delivery Hero; a dual-class share structure under which Class B shares carry disproportionate voting rights; reliance on non-IFRS measures including Adjusted EBITDA, Segment Adjusted EBITDA and Adjusted Free Cash Flow, the definition of the last of which was changed in the second quarter of 2026; unaudited financial information relating to Atome Financial derived from management accounts that have not been reviewed or audited; and material dispersion in published analyst estimates, where 2027 consensus earnings per share range from $0.05 to $0.25 and price targets across the panels reviewed range from $4.60 to $8.00. Technical analysis presented reflects historical price and volume data and is not a guarantee of future movements; support and resistance levels, relative-strength readings, moving averages, break-of-structure and change-of-character markers and Fibonacci retracements are lagging or interpretive indicators with well-documented limitations. Scenario analysis, price targets and probability weightings are based on publicly available information, independent modelling and analyst-consensus data as of September 25th 2026; actual results may differ materially. Entry, target and stop levels reflect scenario-based analysis, not price predictions. Always conduct your own due diligence and consult a qualified financial advisor before making any investment decision. Position-sizing observations are general in nature and do not account for individual circumstances, tax situations or risk tolerance.