Most desks have spent eighteen months pricing Uber as if Waymo and Tesla are about to gut the ride-hailing business in 2026. Looking at the actual print: Q1 2026 revenue $13.2B (+14% YoY), gross bookings $53.7B (+21% constant currency), non-GAAP operating income $1.92B (+42%), non-GAAP EPS $0.72 (+44%), free cash flow $2.29B, $3B of stock retired in the quarter alone. That is not a company being disrupted. That is a company compounding at near-record operating leverage while its multiple is being compressed in the opposite direction.
Two charts tell the whole story. Quarterly FCF tripled from $768M in December 2023 to $2.29B in March 2026. P/FCF compressed from roughly 50x to 14.62x over the same window. Fundamentals up; multiple down. That sort of two-line divergence is rarely a permanent state, and almost never a coincidence. It is sentiment doing what sentiment does when a long-feared disruption narrative dominates an otherwise improving business.
Price has tested the lower band of the scenario entry zone three times since early March: first on a broad AV-narrative flush, again in April on a fresh wave of robotaxi headlines, and now on May 29th compounded by May 21st Massachusetts driver union ruling, with Stochastic RSI at 15.3 and the 200-day moving average sitting overhead. A triple bottom in formation, oversold on the lower indicator, and a $20B buyback program with $16B still authorized chewing through the float at $3B per quarter. That is the entry window the desk is taking.
Scenario entry sits in a tight band just below current print. Target zone runs materially higher over a 9–12 month horizon. Stop sits below the triple-bottom structure, a level that invalidates the setup and tells me the bears were right after all. Risk/reward at the midpoints is asymmetric in our favour. Wall Street's consensus 1-year target reads as a conservative lower anchor for the upside this setup describes, not an outlier.
Coordinates – Snapshot of Where Uber Sits Today
Coordinates – Snapshot of Where Uber Sits Today
Before I walk through the thesis, here is the desk's read of Uber as of May 29th 2026. Eight numbers that frame what Uber actually looks like under the hood, not a meme version from 2022, not a "robotaxi loser" caricature from late 2025.
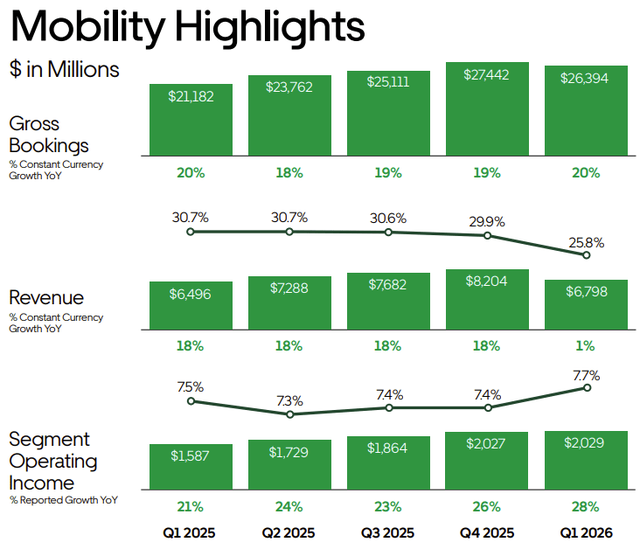
Read that as a panel of dials. Top line decelerated optically to 14%, but underneath the headline rate sits a 9-point UK accounting headwind that has zero impact on economics. Gross bookings, the cleaner measure of what is actually moving through the platform, printed 21% on a constant-currency basis. Operating income is growing at three times the pace of revenue. EPS is growing at three times the pace of revenue. Free cash flow has tripled in nine quarters. None of those lines describe a company being eaten by Waymo.
Mobility Orchestrator, Not Ride-Hailer
Mobility Orchestrator, Not Ride-Hailer
Most pieces I read on Uber still anchor on the 2014 framing: app, driver, passenger, take rate. That model is correct as far as it goes, and it explains roughly half of what the company actually does today. Everything else (Eats, Freight, Reserve, hotels, advertising, the autonomous partner stack) is what makes the mispricing live.
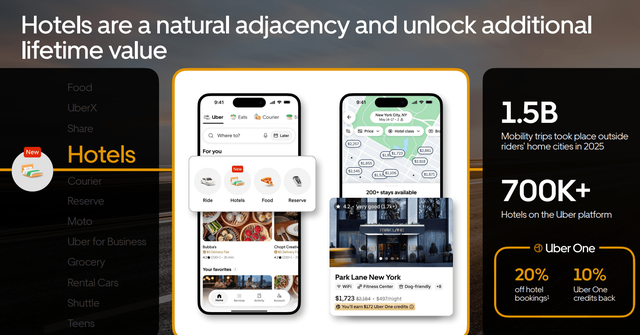
A useful reframe comes from the FourWeekMBA team's spring 2026 model of Uber's $52B revenue stack: "Uber will evolve from a ride-sharing platform into an autonomous mobility orchestrator, coordinating fleets of self-driving vehicles while expanding into AI-driven logistics, food delivery optimization, and urban transportation infrastructure management." That description fits the operating data: 30+ autonomous partners feeding trips through Uber's network, 50M Uber One members generating half of all bookings, 700,000+ hotels live via the Expedia partnership, a $2B-run-rate advertising business growing 50%+, and 14.2B annual trips across mobility and delivery combined.
What this matters for is the disruption framing. A pure rideshare app gets disrupted by a better rideshare app, or by a robotaxi that bypasses the labor cost line. A platform orchestrator that operates as the demand layer above 30 autonomous partners, 10M drivers and couriers, 700K hotels, and the largest food delivery network outside China gets disrupted by something else, or by nothing in the time horizons most bears assume. When Khosrowshahi said on the Q1 call that "a hybrid network will unlock significant long-term value", he was describing the structural reason Uber's category position improved in San Francisco and Los Angeles over the last six months despite Waymo running thousands of rides a week in both cities.
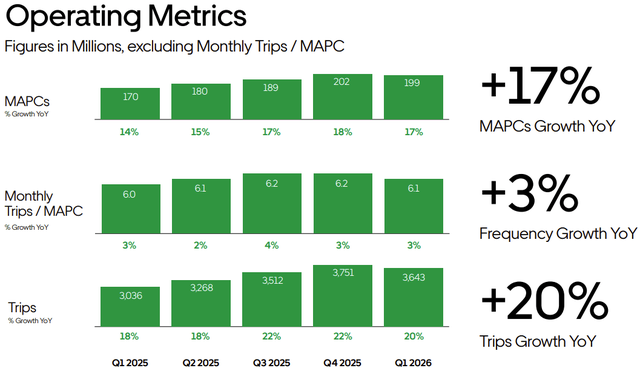
Three takeaways sit underneath those numbers. Mobility is no longer a single-leg story even inside the Mobility line, since Reserve, Black, Comfort, Share and Wait & Save now span a barbell that drives both daily frequency and incremental margin. Delivery has crossed into operational scale where its 3.7% segment margin on $26B of gross bookings produces $961M of operating income, a meaningful contributor to consolidated profits, not the loss leader most investors still imagine. And the platform take rate of ~28% (on $162B of trailing twelve-month gross bookings) is what compounds when volumes rise without proportional cost increases, Uber's most underappreciated structural feature.
Why Now – Setup Behind Today's Entry
Why Now – Setup Behind Today's Entry
Let me be clear with you about why this piece is landing on May 29th and not three months earlier or three months later. There is a specific window opening, and it is the product of three sentiment shocks landing on top of a business that has not deteriorated to match.
First, on May 6th, Uber printed its Q1 2026 numbers. Gross bookings beat by $800M. Non-GAAP operating income grew 42%. Non-GAAP EPS grew 44%. Free cash flow hit a record $2.29B in a single quarter. Headlines focused on a $50M consolidated-revenue miss caused by a UK accounting reclassification. Stock rose 8% on the day as better analysts read past the headline, then drifted back over three weeks as AV-disruption narrative reasserted itself. Detail in Section 04 below.
Second, the AV story dominates the tape. Waymo is genuinely scaling. Tesla launched its first robotaxi pilot in Austin in mid-2025. Both are real. Both are happening on a timeline that the operating data says will take longer than the stock price implies. Section 05 walks through this in full.
Third, on May 21st, the App Drivers Union (a first-of-its-kind labour body for rideshare drivers) was certified in Massachusetts. UBER fell 5–6% in the two weeks that followed, taking out a short-term floor and putting price at a third test of the lower band of the scenario entry zone that has held since early March. Today's $70.40 print is the result of three months of compounding sentiment shocks against a business that has not slowed.
Stitch those three threads together and you get the cleanest mispricing setup the desk has seen in this name since 2022. Sentiment lag against compounding fundamentals; technical structure forming a base at $70 with prior support six dollars below; consensus analyst targets sitting 52% higher; $16B of buyback authorisation chewing through the float at $3B per quarter. What follows is each piece of the case worked through in turn: what Uber actually is operationally, where Q1 was misread, why a partnership AV model wins on a multi-year horizon, where growth is coming from geographically, and what cash flow plus valuation triangulation produce on the other side.
Q1 2026 – When a Headline Misreads Its Own Print
Q1 2026 – When a Headline Misreads Its Own Print
On May 6th, headlines went out describing Uber's Q1 as "mixed" because consolidated revenue printed $13.2B against consensus of $13.25B, a $50M miss that I'd call rounding error on a $13B base. Inside the same release was a 20% gross bookings beat. Stock rose 8% on the day. Tape and tape-reader disagreed, and tape was right.
Two mechanics drove the apparent revenue weakness, and both are deceptive. First, the company changed how it accounts for UK Mobility transactions; payments to drivers now offset revenue instead of sitting in cost of goods sold. That single accounting reclassification stripped roughly nine percentage points off the Mobility revenue growth rate, taking the segment from a clean 25% gross bookings growth to a reported 1% revenue growth. Krishnamurthy spent half the call walking analysts through it. Underlying volumes did not change. Take rate did not change. Only the geometry of the income statement changed.
Second, $1 billion of revenue is being given back to drivers as insurance savings get returned to riders via lower prices, exactly the elasticity loop Krishnamurthy described as "the first year since COVID where we expect to see good leverage on our insurance cost line for the U.S. Mobility business." Lower insurance cost feeds lower fares feeds more rides feeds more take. That is the textbook flywheel for a marketplace, and the data already confirms it is firing. Los Angeles, the U.S. market most damaged by insurance inflation over the prior two years, is now growing trips materially faster than the rest of the country.
"All in all, it's putting us in a place where this will be the first year since COVID where we expect to see good leverage on our insurance cost line for the U.S. Mobility business. As we've said before, our philosophy has been to return that goodness back to the market, and consumers see improvement in the pricing environment for Uber rides on the system. So as a result of that, we are seeing really good elasticity."
Balaji Krishnamurthy, CFO, Q1 2026 Earnings Call, May 6th 2026A cleaner read of Q1 looks like this: gross bookings $53.7B (+21% constant currency), Mobility gross bookings $26.4B (+20% cc), Delivery gross bookings $26.0B (+23% cc), Freight back to growth for the first time in two years at +6%. Trips 3.6B (+20%), MAPCs 199M (+17%), Uber One members past 50M with members generating roughly half of all gross bookings. Non-GAAP operating income $1.92B at a 3.5% of gross bookings margin (up from 3.1% in Q1 2025). Non-GAAP EPS $0.72 (+44%). And FCF of $2.29B against a $1.92B operating income line, cash generation exceeding operating profit, which is structurally what a working-capital-positive marketplace at scale does.
That is not a "mixed" quarter. That is the cleanest set of operating numbers Uber has ever printed. Markets eventually agreed: the stock closed up 8% on May 6th. It then gave most of those gains back over three weeks as AV-disruption narrative reasserted itself, a Delivery Hero bidding war added near-term overhang, and Massachusetts driver union news on May 21st knocked the entire ride-share complex down 5–6%. Q1 numbers describe a business that did not slow; the price action describes a market that decided otherwise. Why that gap stays open, and why I think it closes, is what follows in this piece, beginning with the AV question that dominates any bear case.
Important Disclaimer
This content is for informational and educational purposes only and does not constitute financial advice, investment recommendations, or solicitation to buy or sell any securities. Past performance does not guarantee future results. All investments carry risk, including the possible loss of principal. Uber Technologies, Inc. (NYSE: UBER) is subject to market risk, technological disruption risk from autonomous-vehicle competitors including Waymo (Alphabet) and Tesla, regulatory and labour-classification risk in multiple geographies, foreign-exchange and accounting-treatment risk in international markets, equity-method investment volatility on stakes in Didi, Grab and Lucid, execution risk on the Delivery Hero acquisition attempt, integration risk on existing and announced AV partnerships, and competitive risk from DoorDash, Lyft and regional ride-sharing operators. Earnings estimates, price targets and fair-value calculations cited in this analysis are based on publicly available information and independent analytical models as of May 2026; actual results may differ materially. Scenario entry, scenario target, stop-loss, risk/reward and probability assignments reflect scenario-based modelling, not price predictions. Always conduct your own due diligence and consult a qualified financial advisor before making any investment decision.