Fintech - Large Cap

HOOD - From Meme Stock to Financial Super-App: 52% Revenue Growth, Record EPS & a Market That Still Sees January 2021

Robinhood Markets, Inc. (NASDAQ: HOOD)
March 24, 2026 9-12 Months Moderate-High Risk
Outlook
Bullish
Time Horizon
9-12 Months
Scenario Entry Range
$60-$70
Target Zone
$106-$126
Risk / Reward
~1 : 2.5
Trading Floor Dispatch March 24, 2026 | PMIS Research

Five years ago, Robinhood was that company. The one that halted GameStop trading. The one hauled before Congress. The one whose stock fell from $85 to $7.70 while retail traders seethed. The meme-stock villain. That narrative hardened fast - Robinhood was a gamified toy for reckless speculators, one crypto winter away from irrelevance. Not entirely wrong. Just about two years out of date.

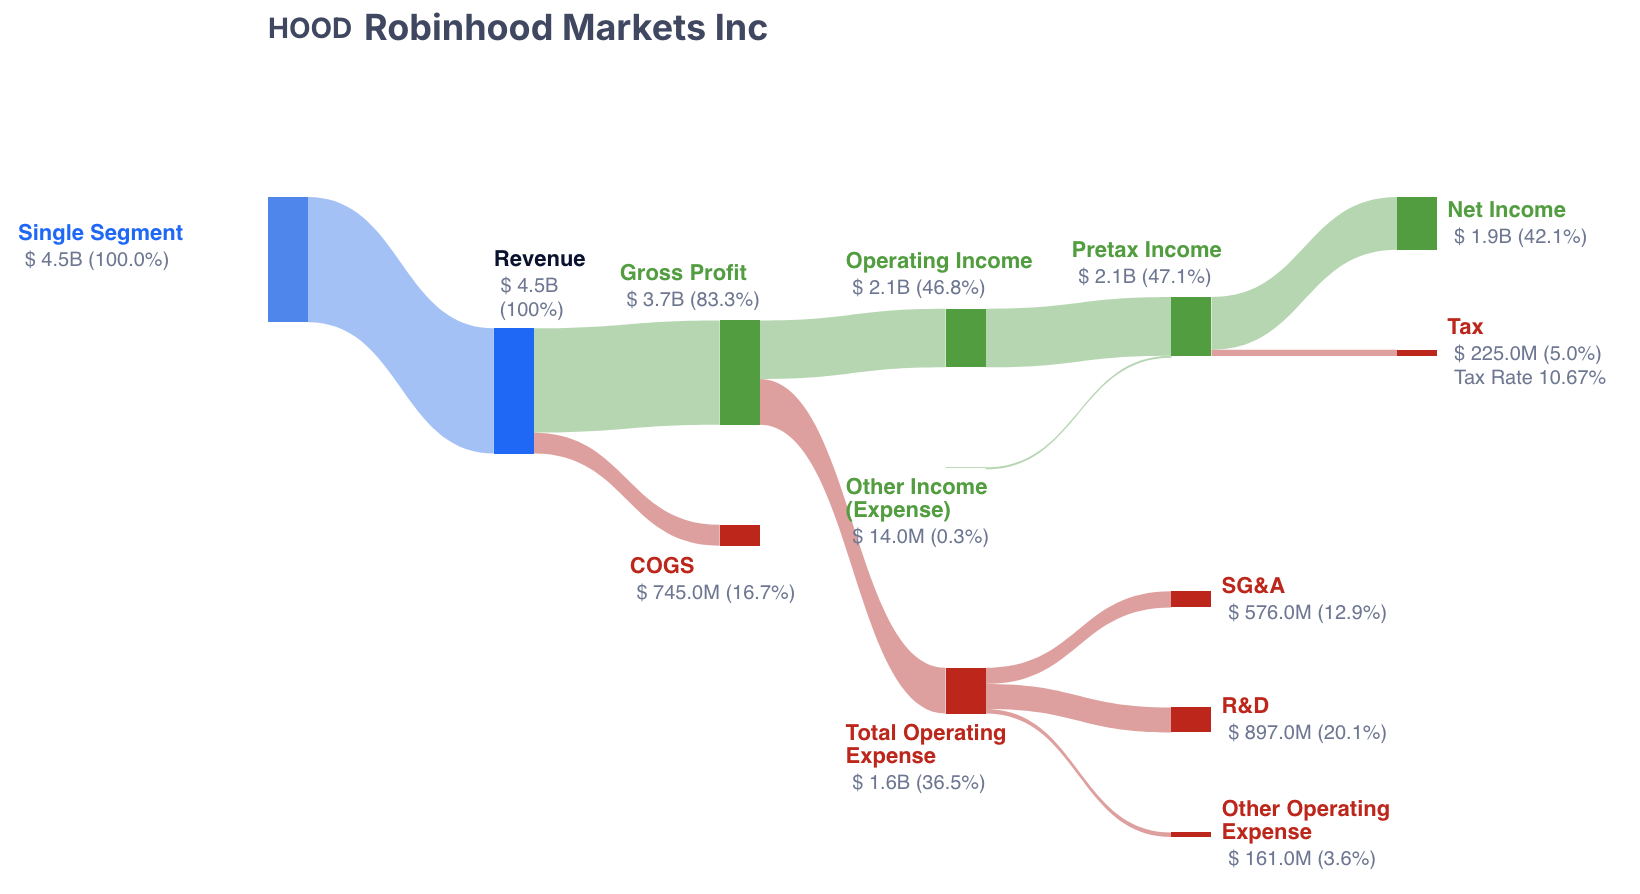
What the company actually delivered in 2025 wasn't a lucky quarter on the back of a crypto wave. It was $4.5 billion in revenue (up 52%), $1.9 billion in net income (EPS $2.04), $68 billion in net deposits, and 11 distinct business lines each generating over $100 million in annualized revenue. The company investors still mentally associate with GameStop now processes more options contracts than any U.S. brokerage, manages $324 billion in platform assets, and has 4.2 million paying Gold subscribers. Not a trading app. A financial operating system.

And yet. The stock is down 51% from its October 2025 highs. At roughly $72, you're paying about 29x forward non-GAAP earnings for a company growing revenue at 52%, with 56% adjusted EBITDA margins, a $1 billion buyback running, and a product pipeline covering private markets (Robinhood Ventures), AI advisory (Cortex), social trading, full banking, and international expansion into a $100 trillion generational wealth transfer. Coinbase - a company that is narrower, slower-growing, and more crypto-dependent - trades at a 75% P/E premium. Think about that for a second.

The entry zone of $60-$70 reflects one simple view: the pullback - crypto cooling, macro fear, guilt-by-association with the broader fintech sell-off - has opened a window where the stock price is still narrating 2021 while the business is already living in 2026. That gap is the trade.

01

Robinhood at a Glance

Vlad Tenev and Baiju Bhatt were Stanford roommates with a simple pitch: democratize finance for all. Commission-free trading. No account minimums. The whole U.S. brokerage industry - Schwab, Fidelity, E*Trade, all of them - was eventually forced to follow. Robinhood went public in July 2021 at $38 per share, just months after the GameStop fiasco made it simultaneously the most famous and most hated company in retail finance.

What came next was ugly. The stock bottomed near $7.70 in 2022 as retail trading volumes dried up and rates climbed. But something interesting happened during that two-year nuclear winter: Robinhood rebuilt. IRAs with matching programs. The Gold subscription tier. Bitstamp acquisition for institutional crypto. An entirely new product stack. By late 2024, the company was GAAP profitable for the first time. By the end of 2025, eight consecutive profitable quarters and $1.9 billion in full-year net income. Most investors missed the whole thing.

$4.5B FY 2025 Revenue
$2.04 GAAP EPS (2025)
$324B Platform Assets
27.4M Funded Customers
4.2M Gold Subscribers
$68B Net Deposits 2025
56% Adj. EBITDA Margin
11 $100M+ ARR Lines

The company now serves 27.4 million funded customers across 28.4 million investment accounts. Over 40% of total assets are parked in ETFs, advisory products, retirement accounts, and cash - not crypto, not meme stocks. The speculative trading narrative that defined 2021 just doesn't match the actual asset mix anymore. The market's mental model is stuck in the past. The business isn't.

02

The Transformation - From Trading App to Financial Super-App

Here's what I keep coming back to: the Robinhood you remember from 2021 doesn't really exist anymore. That company was a single-product brokerage - live and die by PFOF from speculative options and crypto. The company operating today is a three-pillar financial platform with ambitions that put it directly in the path of Schwab, Fidelity, Coinbase, PayPal, and Goldman Sachs' consumer division. All at once.

It started in 2022 with a 1% IRA match (now 3% for Gold members). Audacious, frankly. The message was unambiguous: Robinhood wanted customers for decades, not for a bull market cycle. And it worked. Over 40% of total platform assets now sit in ETFs, advisory products, retirement, and cash - a number that would have been laughable to describe in 2021. Customers who open retirement accounts have lower churn, bigger balances, and longer lifetimes. The boring long-term stuff, it turns out, builds durable businesses.

"Over 40% of our total assets are now across ETFs, advisory, retirement and cash. It's great to see customers trusting us with more of their financial lives."

- Vlad Tenev, Q4 2025 Earnings Call

Then came the Gold Card in 2024 - 3% cash back, 600,000+ active users, $10 billion in annualized spend. Banking launched late 2025 with 25,000 funded customers depositing $400 million out of the gate, and over 50% enrolled in direct deposit within months. That last number surprised me. Direct deposit enrollment is the kind of stickiness metric that banks spend years and significant money to achieve. Robinhood got there in the product's first months. Also in that same 18-month window: Robinhood Strategies (advisory), TradePMR (access to the $7 trillion RIA custody market), and Legend (desktop platform for serious traders).

The velocity is what separates this company from its peers right now. Tenev's framing from the Q4 call: the goal is "wallet share" - Robinhood customers should never need another financial app. So far, the data supports the ambition. Eight consecutive quarters of positive net transfers from all major brokerage competitors. Eight quarters. That stat doesn't come from a trading app. It comes from a platform that's genuinely taking market share from institutions that have been in this business for decades.

03

Revenue Architecture - Three Pillars, Eleven Business Lines

The old Robinhood basically lived on Payment for Order Flow. That was the vulnerability, and the bears were right to flag it. But the business has since built a three-pillar revenue structure, and the most common bear argument now - "Robinhood depends on crypto" - is only partially correct. That partial truth is exactly what the market is mispricing.

Transaction-Based

~$2.6B
+60% YoY
PFOF from options ($314M Q4), equities ($94M Q4), crypto ($221M Q4), futures, event contracts ($147M Q4). Options now 25% of total revenue.

Net Interest

~$1.5B
+39% YoY (Q4)
Margin balances ($17.2B, up 98% YoY), cash sweep, securities lending, credit card receivables. Stable even during trading slowdowns.

Subscriptions & Other

~$331M
+70% YoY
Robinhood Gold at $5/month (4.2M subscribers), proxy revenues, ACATS fees, card interchange, Sherwood Media. Recurring and sticky.
Robinhood quarterly revenue breakdown Q4 2023 to Q4 2025 showing transaction, interest, and other revenue growth
Total net revenues grew 27% YoY to a record $1.3 billion in Q4 2025, with ARPU reaching $191. Note the diversification - transaction-based (yellow-green), net interest (gray), and other (light gray) are now much more balanced than the pre-2024 era. Source: Robinhood Q4 2025 Investor Presentation.

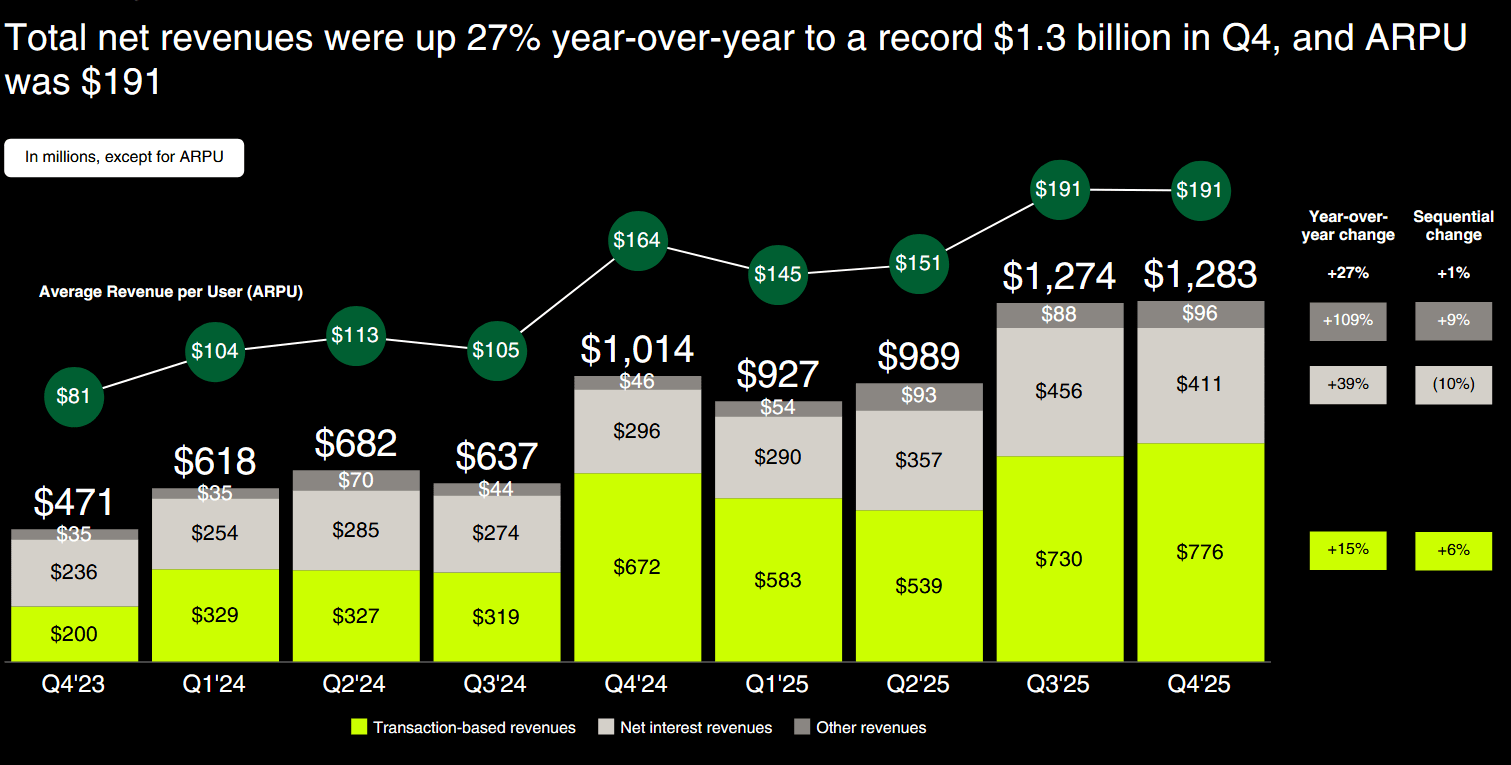
In Q4 2025, crypto transaction revenue was $221 million. Real money. But only 17% of total quarterly revenue. The "lives and dies by crypto" narrative just doesn't hold up against that mix. Run an extreme scenario: crypto transaction revenue falls to zero. Robinhood still generates approximately $1.06 billion in that quarter from equities, options, futures, event contracts, net interest, and subscriptions. Annualized, that's over $4.2 billion - higher than the company's entire 2024 revenue. The floor has moved.

ARPU reached $191 in Q4 2025 (trailing twelve months), up 16% year-over-year. And what's interesting here isn't the number itself - it's what's driving it. This isn't growth from adding cheap, low-engagement customers. Existing customers are trusting Robinhood with more of their money, more product categories, more of their financial life. That's the kind of growth that compounds in ways that are hard to model from the outside.

04

Q4 2025 Earnings & the Numbers Behind the Narrative

The Q4 2025 results are worth sitting with for a moment. Full-year revenue hit $4.5 billion - 52% growth year-over-year. That's the second consecutive year above 50%. Adjusted EBITDA reached a record $2.5 billion at 56% margins. Incremental EBITDA margins above 70% for the third straight year. The cost structure is scaling efficiently - revenue growing faster than expenses, which is exactly what you want to see at this stage.

Robinhood total platform assets growth from $103B in Q4 2023 to $324B in Q4 2025
Total Platform Assets grew from $103B in Q4 2023 to $324B in Q4 2025 - a near-tripling in two years. Source: Robinhood Q4 2025 Investor Presentation.

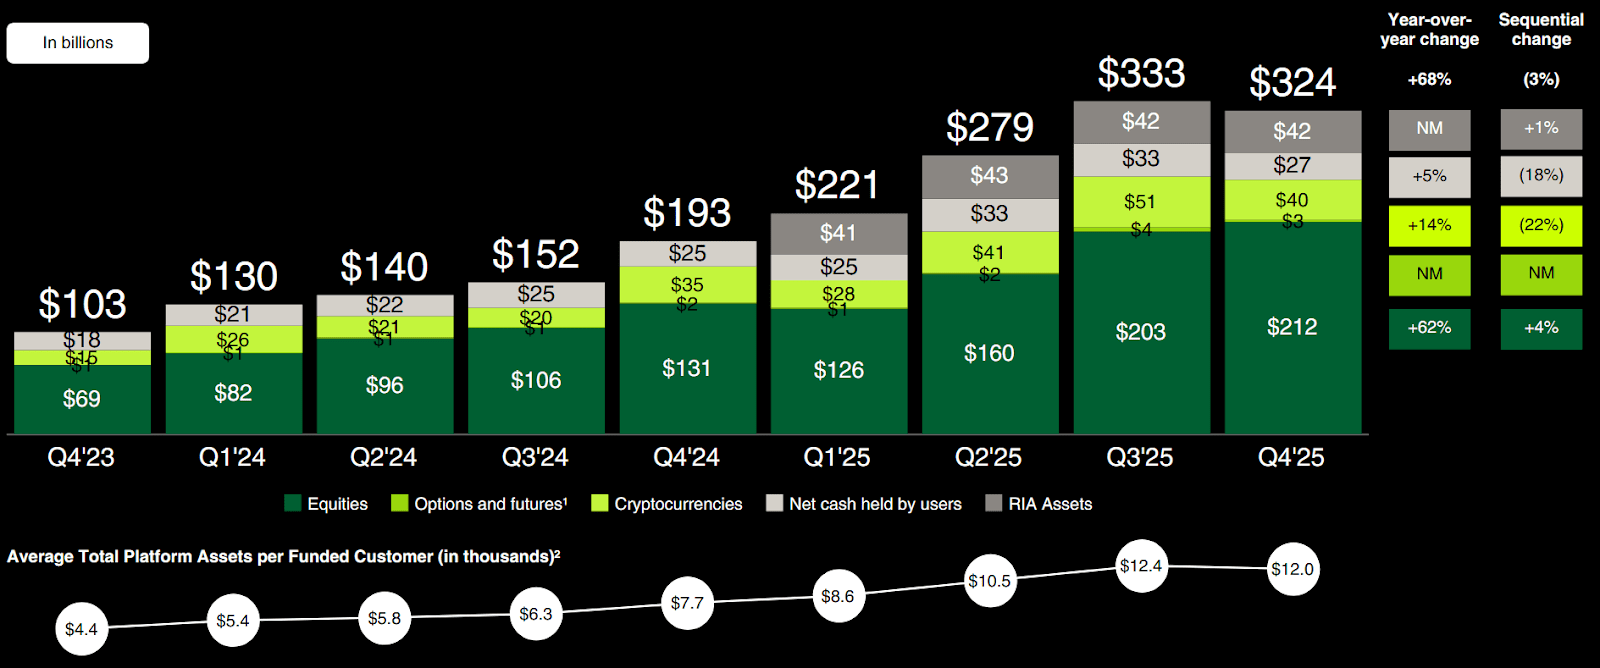
Net deposits of $68 billion for the full year. Not total assets - net new money customers chose to add beyond market appreciation. That's a 35% annualized growth rate, and to put it in context: Robinhood brought in roughly as much fresh capital in 2025 as some regional banks hold in total deposits. Q4 alone was $16 billion. That was the eighth consecutive quarter above $10 billion. At some point you have to stop calling this a trend and start calling it a machine.

But it wasn't just a top-line story. Net income reached $1.9 billion. EPS of $2.04 reflects capital discipline as much as earnings growth - the denominator matters, as CFO Shiv Verma put it directly. Robinhood has a $1 billion+ buyback running, and during a period where the stock has fallen 51%, that program is buying back shares at what management clearly believes are deeply discounted prices. When companies buy back stock at multi-year lows, that's worth paying attention to.

Robinhood revenue breakdown showing how the company makes money across transaction-based, net interest, and subscription revenues
The transformation in profitability is striking. From a full-year net loss of $1 billion in 2022 to $1.9 billion in net income for 2025 - nearly a $3 billion swing in three years. This is how Robinhood makes its money. Source: TAG.
05

The Growth Moats - Prediction Markets, Ventures & AI

If the existing business were all there was, the valuation math would be cleaner. But the really interesting part of the Robinhood story right now is the product pipeline - businesses that are either in early monetization stages or simply not yet in analyst estimates at all. Not vaporware. Live products with actual revenue and actual users.

Prediction Markets - The Fastest-Growing Business in Robinhood's History

Prediction markets hit a $300 million+ annualized run rate in their first full year. 12 billion contracts traded in 2025. Then in just the first weeks of 2026: $4 billion more. Tenev called it "the start of a prediction market super cycle" - and I'd normally flag that as founder hyperbole. But the volume data makes the case without the CEO's commentary.

The pipeline here goes deeper than most investors realize. Rothera - the JV with Susquehanna - gives Robinhood vertical control over the exchange layer: listing, pricing, full economics. Right now the company shares economics with third-party exchanges. When Rothera goes live (targeted mid-2026), Robinhood captures everything. Shiv Verma's framing at the Citizens JMP conference was surprisingly candid: "Our mental model is a digital newspaper and source of information - whether you're looking for economics, financials, lifestyle, sports - everything there is instantly and in real time." That's not a prediction markets pitch. That's an information business pitch.

Robinhood Ventures - Democratizing Private Markets

Robinhood Ventures Fund I (NYSE: RVI) started trading on March 6, 2026. Concentrated positions: Databricks (23.24%), Revolut (14.30%), Mercor (14.23%), plus Airwallex, Boom Supersonic, Oura, Ramp, Stripe, ElevenLabs. The thesis is simple and massive - 85-90% of Americans aren't accredited investors. They've been structurally locked out of private markets for decades. Robinhood is opening that door.

Robinhood Ventures Fund I (RVI) portfolio allocation showing Databricks at 23.24%, Revolut at 14.30%, Mercor at 14.23%, and cash at 19.78%
RVI portfolio composition at launch. The fund has since added Stripe and ElevenLabs. Source: Robinhood Ventures.

Verma has been unambiguous about the opportunity: "private assets are the #1 thing customers want right now." The vision isn't a single fund - it's Robinhood as the retail gateway to every private market asset class, packaged as listed 40 Act funds with daily liquidity, no accreditation requirements, and no carry. Fund management fees, custody, and the brand value of being where retail investors first touched Databricks or Stripe before the IPO. That last part - the halo effect - doesn't show up in any analyst model.

Cortex AI - "What Cursor Is to Engineers, Cortex Will Be to Traders"

On AI: Robinhood is moving faster here than the coverage suggests. Internally, 75% of customer service tickets are now AI-answered - from near-zero two years ago. For retail customers, Cortex Digests already synthesize portfolio movements and explain stock drivers in plain language. The Cortex Assistant is rolling out in early 2026. And for advanced traders, Cortex for Legend is where it gets interesting - Tenev's comparison was "what Cursor is to software engineers." He didn't say it's like Cursor. That IS the ambition.

Robinhood is already in conversations with regulators about Cortex providing actual portfolio advisory recommendations - not just information, but personalized advice. That's the wealth management industry's entire business model, delivered at AI cost. The technology exists today. The gating factor is regulatory clarity on Reg BI rules. When that clears, every RIA in the country will have a new competitor.

06

Competitive Landscape - Why HOOD Over COIN

The cleanest way to understand Robinhood's value right now is to put it next to Coinbase. Both carry crypto exposure. Both are transaction-heavy with subscription revenue growing underneath. Both face the same regulatory and macro risks. The market prices them dramatically differently. That gap, in my view, is the mistake.

Growth comparison table showing HOOD outperforming COIN, MA, PYPL, BLK, and IBKR across revenue growth, EBITDA growth, and EPS growth metrics
Growth metrics across financial peers: HOOD leads in Revenue Growth YoY (51.6%), 3-Year Revenue CAGR (48.8%), and EPS Diluted 3-Year CAGR (33.3%). The company is growing faster than Mastercard, PayPal, BlackRock, and Interactive Brokers on every meaningful growth metric. Source: Seeking Alpha.

Coinbase trades at a 75% P/E premium over Robinhood despite inferior growth, greater crypto concentration, and higher SBC dilution. The "institutional quality" argument for Coinbase is real - but Robinhood's own institutional build (Bitstamp, TradePMR) is closing that gap fast. And at some point, the premium needs to reflect actual metrics, not perceived prestige.

Valuation comparison showing HOOD at 29x forward P/E vs COIN at 51x, with HOOD cheaper than COIN on every valuation metric
Valuation comparison across peers. HOOD trades at 29.1x FY1 P/E vs. COIN at 51.5x. On a PEG basis (growth-adjusted), HOOD at 1.82 is nearly half of COIN's 3.10. Even against traditional fintech (MA, PYPL), HOOD offers a compelling multiple given its superior growth rate. Source: Seeking Alpha.

Consensus 2026 estimates tell the story plainly: HOOD revenue growing 28.9%, Coinbase revenue declining 14%. Same market environment. That gap reflects Robinhood's structural advantage - it's an equities, options, and crypto broker with prediction markets, banking, and advisory on top. Coinbase is still predominantly a crypto exchange. In a crypto downturn, both stocks get hit. But Robinhood has far more ballast. That difference in structure should be worth more than a 75% P/E discount.

Robinhood EPS estimates 2025-2028 showing consensus growth from $2.04 to $3.53
Consensus EPS estimates show a clear growth trajectory: $2.04 (2025 actual), $2.35 (2026E), $2.88 (2027E), $3.53 (2028E). The 2025 actual came in above the prior consensus, and Robinhood consistently beat estimates throughout the year. Source: Barron's.
Robinhood quarterly EPS actual vs estimate showing consistent beats in every quarter of 2025
Robinhood beat EPS estimates in every quarter of 2025: Q1 ($0.37 actual vs $0.33 est), Q2 ($0.42 vs $0.31), Q3 ($0.61 vs $0.54), Q4 ($0.66 vs $0.63). The surprise widened in the middle of the year before narrowing slightly as analysts caught up with the business trajectory. Source: Barron's.
07

Management Vision - Vlad Tenev's "Financial Super-App"

Vlad Tenev's arc over five years is worth acknowledging. Congressional witness. Villain in the GameStop narrative. Now: public company CEO executing a multi-year platform playbook with unusual precision. Whether you like him personally doesn't really matter at this point. The three-arc strategy from Investor Day - #1 in active traders, #1 in wallet share for the next generation, #1 global financial ecosystem - is being executed methodically. The data backs that up.

"We've had positive net transfers - positive inflows from all of our major brokerage competitors - for the last 8 quarters in a row. We think we've got a lot of headroom here."

- Vlad Tenev, Q4 2025 Earnings Call

CFO Shiv Verma - 8-year Robinhood veteran, architect of much of the growth strategy - brings continuity that the market tends to undervalue. His framing at the Citizens JMP conference was unusually direct for a CFO: "What are we optimizing for shareholders? Earnings per share, free cash flow per share over time. That's how you should judge us." No hedging. No "long-term value creation" jargon. Just the denominator. Expense growth guided at 18% for 2026 (down from 22% in 2025), with more than half of incremental spend going toward new businesses. Operating leverage improving even while the investment pace accelerates.

Tenev also floated the concept of a "job singularity" at a recent TED Talk - a period where AI enables individuals to operate with the capability of full organizations. It sounds like founder-stage philosophizing. But there's a direct product implication: if a single person can eventually run an investment operation that previously required a team, they need a platform that handles trading, banking, advisory, tax, and custody in one place. And they'll need it to be good. That is exactly what Robinhood is building. Whether Tenev's framework is right or not, the product bet is sound.

08

Valuation - What the Numbers Say

At roughly $72, Robinhood trades at about 29x forward non-GAAP earnings (FY1) and 26.7x FY2. On a GAAP trailing basis, about 35x. These aren't cheap multiples, and I'm not going to pretend they are. But multiple evaluation without growth context is analytically useless. Against 52% revenue growth, 56% EBITDA margins, and a product pipeline that isn't fully in consensus estimates yet, the multiple looks different.

The Simply Wall St fair value model recently trimmed 6% to $124.62, using 18.4% long-run revenue growth and 43.4% future net margins. Goldman Sachs, BofA, Cantor Fitzgerald, Mizuho, and Argus all maintain positive ratings with targets in the $120 to $130 range. Consensus "Moderate Buy" with a ~$124 fair value implies roughly 70% upside from here. Seven different analysts, different methodologies, similar destination.

HOOD share price at $73.39 vs fair value estimate of $132.19 showing 44.5% undervaluation on Simply Wall St model
Simply Wall St's fair value model prices HOOD at $132.19 (recently trimmed to $124.62 after updated inputs). At $73.39, the stock sits 44.5% below the calculated fair value. The pink line (fair value) and green line (stock price) diverged sharply beginning in early 2026 as the stock corrected while fundamentals continued improving. Source: Simply Wall St.
PitchGrade score for Robinhood showing C+ rating with 24/25 profitability, 12/25 growth, 17/25 financial health, 11/25 valuation
PitchGrade Score: C+ overall. Profitability scores 24/25 (near perfect) and Financial Health at 17/25 are strong. Growth at 12/25 reflects the deceleration from peak 2025 rates, while Valuation at 11/25 flags the premium multiple - though this must be weighed against the growth profile. Source: PitchGrade.

The honest question isn't whether Robinhood is cheap - it isn't, by traditional brokerage standards. The question is whether the multiple is appropriate for the growth rate and quality of that growth. PEG of 1.82 puts HOOD almost exactly in line with Interactive Brokers (1.78) and meaningfully below Coinbase (3.10). You're paying a similar growth-adjusted premium to IBKR while getting a company growing faster. You're paying a big discount to COIN while getting a company that is more diversified and growing faster. Both comparisons make the same point.

09

What the Market Sees vs. What the Business Shows

What the Market Fears
  • Crypto winter reduces transaction revenue significantly
  • Payment for Order Flow faces regulatory ban risk
  • Interest rate cuts compress NIM revenue
  • Prediction markets are a fad - post-NFL season volume collapses
  • Customer base is speculative "dumb money" that churns
  • Robinhood can't compete with Schwab/Fidelity for serious money
  • The stock was wildly overvalued at $150+, still has further to fall
  • 51% decline means something is fundamentally wrong
What the Business Shows
  • Crypto is 17% of Q4 revenue - and declining as % of total mix
  • CLARITY Act softened PFOF ban risk; transparency approach adopted
  • Rate cuts grow margin lending demand and deposit attractiveness
  • NBA volume surpassed NFL; non-sports contracts growing fast
  • 40%+ of assets in ETFs/retirement/advisory - not meme stocks
  • 8 straight quarters of positive net transfers FROM competitors
  • At $72, fwd P/E is 29x with 52% revenue growth - cheapest since IPO on growth-adjusted basis
  • Business metrics improved every quarter while stock fell
10

The Bear Case - Addressed Honestly

Let's be honest about what the bears have. HOOD ran from $7 to $153 in under two years. After a move like that, a 50% correction isn't surprising - it's expected. The bearish camp argues further downside is the path of least resistance, and after a run that steep, the skepticism is reasonable. So let's give those arguments a full hearing before dismantling them.

Bear Argument #1: Crypto revenue is unreliable. Partially correct. Crypto transaction revenue fell 38% year-over-year, from $358 million in Q4 2024 to $221 million in Q4 2025. The 2021 hangover pattern, basically. But here's the critical distinction: crypto was over 50% of transaction revenue at the 2021 peak. In 2024, it was 28%. The business has structurally diversified away from exactly this risk. And even after the 38% decline, crypto revenue of $221 million in Q4 2025 was still higher than any quarter before Q3 2024. The floor moved.

Bear Argument #2: Monthly active users declined in 2025. True. But MAU is the wrong lens for where Robinhood sits in its evolution. The company is optimizing for wallet share per customer, not raw headcount. ARPU rose 16% to $191. Net deposits grew 35%. Total platform assets rose 70%. The customers who stuck around are spending more, depositing more, using more products. Trading MAU for wallet share isn't declining - it's what maturation looks like.

Bear Argument #3: Prediction markets depend on football season. Early evidence says otherwise. NBA contracts surpassed NFL in January. The government shutdown contract drove serious volume in the NFL offseason. Olympics, World Cup, March Madness, and expanding non-sports categories are already broadening the base. But - and I want to be fair here - this is a young product and seasonal risk genuinely exists. We factor that into the base case. The bear isn't wrong to flag it.

Bear Argument #4: The P/S ratio is still elevated. At 15.3x trailing sales, the stock sits above its post-IPO average of 11.5x. The bear's point is technically correct. But the average is poisoned by the 2022-2023 period when P/S was 3-5x - when Robinhood was losing money and shedding users. Applying a mean-reversion argument that includes loss-making years to value a company generating $1.9 billion in net income is analytically broken. The right metric is P/E - and at 29x forward with 28.9% forward revenue growth, the multiple is defensible.

Robinhood P/S ratio chart showing current level of 15.27 still above the post-IPO average of 11.57, suggesting further potential decline to the mean
The bear case in one chart: HOOD's Price-to-Sales ratio at 15.27 remains above the post-IPO average of 11.57 (dashed purple line). Bears argue a further 25% decline to the mean is plausible. Our counter: the company's margin profile and growth rate in 2025-2026 are structurally different from the loss-making 2021-2023 period that drags the average down. Source: YCharts.
11

Technical Structure

The technical picture lines up with what the fundamentals say. HOOD has corrected 51% from the October 2025 peak near $153.86, now trading around $72.49. Every major moving average sits above the current price - 20-day at $76.61, 50-day at $86.99, 100-day at $108.15. Trading this far below the 100-day isn't usually where extended downtrends begin for fundamentally healthy companies. More often, it's where they end.

HOOD daily chart showing stock at $72.49 with key support at $71.12 and resistance at $86.56, $107, and $137 - all major moving averages above price
Daily chart: HOOD at $72.49 with key support at $71.12 (recent low) and resistance levels at $77.35, $82.21, $86.56, and $107 (major horizontal resistance, aligning with major moving averages). The red horizontal at $107 represents a critical inflection - a decisive break above it would signal the correction is over. Volume has been declining on the selloff, suggesting exhaustion of selling pressure.
HOOD 10-month chart showing full correction from $137 to $71 with SMA 20, 50, and 100 all converging above as overhead resistance
The broader view shows the full corrective wave from $137 to $71. The 20-day (blue, $76.61), 50-day (pink, $86.99), and 100-day (yellow, $108.15) moving averages are all stacked above price - a "coiled spring" configuration that resolves either with a sharp bounce or a capitulation flush. The green horizontal at the $53.55 level marks the long-term demand zone from mid-2025.
HOOD stock price overlaid with P/E ratio showing the divergence between declining P/E and declining stock price, indicating the selloff is multiple compression not earnings deterioration
This is perhaps the most important chart for the HOOD thesis. The black line (stock price) and purple line (P/E ratio) are tracked from April 2025 to March 2026. Note that the P/E ratio has compressed from roughly 100x at the peak to approximately 35x today - while the stock has fallen from $150+ to $72. The entire correction has been driven by multiple compression, not earnings deterioration. Earnings continued to grow throughout the selloff. This is the hallmark of a repricing opportunity. Source: YCharts.

Key levels: immediate support at $71.12 (March 2026 low), deeper support at $53.55 where significant buying accumulated in mid-2025. On the upside, first resistance cluster is $77.35 and $82.70, then $86.55 near the 50-day. The pivotal number is $107 - that red horizontal on both charts. It aligns with the 100-day moving average and represents the single most important structural level on the chart. Reclaim $107 on volume, and the correction is over. Institutional buyers are watching that level too.

12

Scenario Analysis

The three scenarios below use consensus EPS estimates, P/E assumptions calibrated to Robinhood's growth trajectory, and macro adjustments. Anchored to an entry price of roughly $65 - the midpoint of the $60-$70 zone.

Bear Case

$48-$55
20-22x FY2026E EPS of $2.35
-15% to -26%

Prolonged crypto winter, interest rate cuts compress NIM faster than deposits grow, prediction markets plateau post-NFL, macro recession dampens trading activity. P/S reverts toward 11.5x average.

Base Case

$106-$126
26-30x FY2027E EPS of $2.88
+63% to +94%

Revenue grows 20%+ in 2026, prediction markets scale, Ventures launches successfully, Gold subscribers exceed 5M, banking and credit card gain traction. Multiple stable at 28-30x as growth quality is recognized.

Bull Case

$140-$165
32-35x FY2027E EPS of $3.50+
+115% to +154%

Crypto recovery, prediction market super cycle materializes, international expansion accelerates, Cortex AI advisory approved by regulators, tokenization gains traction. Robinhood re-rated as a platform, not a brokerage.

13

Catalyst Calendar

Q1 2026 (Now)
Robinhood Ventures Fund I Trading
RVI began NYSE trading March 6. Stripe and ElevenLabs added March 12-17. Early demand data will signal the appetite for retail private markets.
April 2026
Robinhood Social Public Launch
Beta with 1,000 users expanding to 10,000+. Public rollout of the social trading platform could boost engagement metrics and new user acquisition.
May 13, 2026
Q1 2026 Earnings Report
First earnings report with February operating data already showing healthy net deposits ($5.6B), rising crypto volumes, and continued funded customer growth to 27.4M.
Mid-2026
Rothera Exchange Operational
The prediction markets JV with Susquehanna goes live, giving Robinhood full vertical control over listing, pricing, and economics. Material improvement in unit economics.
Summer 2026
Olympics & World Cup
Major global sporting events could drive a surge in prediction markets activity, demonstrating the category's durability beyond NFL season.
H2 2026
International Expansion & Cortex AI Rollout
Multiple new international markets launching. Cortex Assistant scaling to full user base. Banking open to all customers. Gold Card surpassing 1 million users. Each represents a potential re-rating catalyst.
14

Risk Register

High

Crypto Winter / Extended Drawdown

Total crypto market cap has fallen from $4.4T to $2.5T. If Bitcoin and Ethereum continue declining, crypto transaction revenue could fall further, impacting both revenue and sentiment. The stock remains correlated to BTC despite diversification.

High

Macro Recession / Trading Volume Decline

A broad economic downturn could reduce trading activity across all asset classes, compress interest-earning assets, and pause the wealth transfer that Robinhood is positioning to capture.

Medium

Interest Rate Sensitivity

Net interest income (~$1.5B) benefits from higher rates. Rapid Fed cutting would compress this revenue. However, lower rates also increase margin lending demand and deposit attractiveness - partially offsetting the impact.

Medium

Regulatory Risk (PFOF, Crypto)

Payment for order flow remains politically sensitive. While the CLARITY Act reduced ban risk, future regulatory changes could still impact transaction-based revenue. FINRA fined Robinhood $26M in March 2025.

Medium

Robinhood Ventures Execution Risk

RVI's concentrated portfolio includes Revolut at a possibly stretched $75B valuation. Fintech IPOs (Webull, Klarna) have underperformed. A downward revaluation of key holdings could hurt fund performance and brand credibility.

Low

Competition from Schwab / Fidelity

Legacy brokerages manage trillions and have deeper product suites. However, their average customer is 50+ years old. Robinhood's demographic moat (average age 35) and digital-native UX provide structural protection in the wealth transfer generation.

15

Scenario Modeling

HOOD | NASDAQ
Scenario Entry Range $60-$70
Target Zone $106-$126
Thesis Invalidation $48
Time Horizon 9-12 Months
Risk / Reward ~1 : 2.5
Risk Level Moderate-High
  • Scenario Entry Range: $60-$70. Build in tranches. Tranche 1 (50%) at current levels ($70-$72). Tranche 2 (30%) on any pullback toward $62-$66. Tranche 3 (20%) in reserve for a potential flush toward $55-$60 on broad market risk-off.
  • Risk Consideration: This is a moderate-to-high risk position due to crypto correlation, multiple compression risk, and macro sensitivity. 3-5% of a diversified portfolio is appropriate. The stock can be volatile on daily moves of 3-5%.
  • Upside Milestones: First exit (30%) at $106-$110 - major moving average reclaim and first major horizontal resistance. Second exit (40%) at $118-$126 - mid-to-upper target zone, analyst consensus fair value. Final exit (30%) at $130+ - full re-rating toward bull scenario.
  • Thesis Invalidation Level: $48. A sustained close below this level would imply the market is pricing in structural revenue decline or regulatory disruption. Below this level, the risk/reward no longer favors the position.
  • Key Monitoring Points: Monthly operating data releases (funded customers, net deposits, trading volumes); quarterly earnings beats/misses; crypto market direction (BTC as proxy); prediction markets volume trends post-NFL; Robinhood Ventures fund performance; international customer growth; Gold subscriber count trajectory.
16

Final Thought - The Second Act Is Being Mispriced

The market has a long memory and a very short attention span. It remembers January 2021 - the trading halts, the Congressional testimony, the $7.70 stock. It remembers that Robinhood customers are meme-stock gamblers and that the business depends on crypto. Those memories aren't wrong. They're just five years old, and the company rebuilt itself while everyone was watching something else.

The March 2026 Robinhood generates $4.5 billion in revenue, $1.9 billion in net income, 56% adjusted EBITDA margins. $324 billion in platform assets. $68 billion in annual net deposits. 4.2 million paying subscribers. 11 business lines each clearing $100 million per year. Number one options brokerage in the United States. Eight consecutive quarters of positive net transfers from every major competitor. Prediction markets, private equity, banking, credit cards, AI advisory, international expansion - all within 18 months. That's the actual business.

The stock fell 51% because crypto cooled, macro uncertainty spiked, and the whole fintech sector got de-rated. Real headwinds. But they're cyclical headwinds applied to a structural growth story. The bear case - Robinhood is a speculative trading app priced for a crypto cycle - was valid in 2021. It's just not the right model for the company operating in 2026. The business diversified. The market's mental model hasn't.

Seven independent analyst groups - Seeking Alpha contributors, Simply Wall St quantitative models, Goldman Sachs, Truist, JPMorgan, Cantor Fitzgerald, and Mizuho - converging on $120-$132 from different methodologies (growth DCF, comp analysis, sum-of-parts, momentum models) says something. No single model is reliable in isolation, and I wouldn't suggest otherwise. But when they all arrive at the same neighborhood from completely different starting points, the current price starts looking like a genuine dislocation.

The $60-$70 entry zone reflects a simple view on risk-reward: downside to bear case ($48-$55) is 15-25%, upside to base case ($106-$126) is 63-94%. Bull case ($140-$165) is above 100% from here. For a company growing revenue at 50%+ with expanding margins, eight consecutive quarterly earnings beats, and a product pipeline that competes with literally every major fintech in the world, setups like this don't show up often.

Robinhood stopped being the rebel at the gate some time ago. It's building the gate now. The question isn't whether the market figures this out - it will. The question is when. And at $60-$70, being early and eventually right costs a lot less than being late and watching the re-rating from the sidelines.

Important Disclaimer

This content is for informational and educational purposes only and does not constitute financial advice, investment recommendations, or solicitation to buy or sell any securities. Past performance does not guarantee future results. All investments carry risk, including the possible loss of principal. Robinhood Markets, Inc. (NASDAQ: HOOD) is subject to market risk, crypto market risk, interest rate risk, regulatory risk including potential changes to Payment for Order Flow regulations, competitive risk from established brokerages, and execution risk on new product launches. The stock has high beta and is correlated with crypto market sentiment. Revenue from transaction-based sources is inherently volatile and may decline significantly during periods of reduced trading activity. Earnings estimates, price targets, and fair value calculations cited in this analysis are based on publicly available information and independent analytical models as of March 2026; actual results may differ materially. The entry and target zones reflect scenario-based analysis, not price predictions. Always conduct your own due diligence and consult a qualified financial advisor before making any investment decision.