Over the past 12 months Trade Desk has traded as high as $91.45. Its 52-week low now stands at $16.70, set within the past week. Three ways to size that fall, all of them true: 82% across the 52-week range, 78% on a straight 12-month return in a year the S&P 500 rose almost 18%, and 88% from the December 2024 all-time high near $140. Charts in this study each carry whichever basis their own source measured, so the figure shifts between them. Story does not. Every doomsday argument you have heard about this company has already been written, published, and paid for.
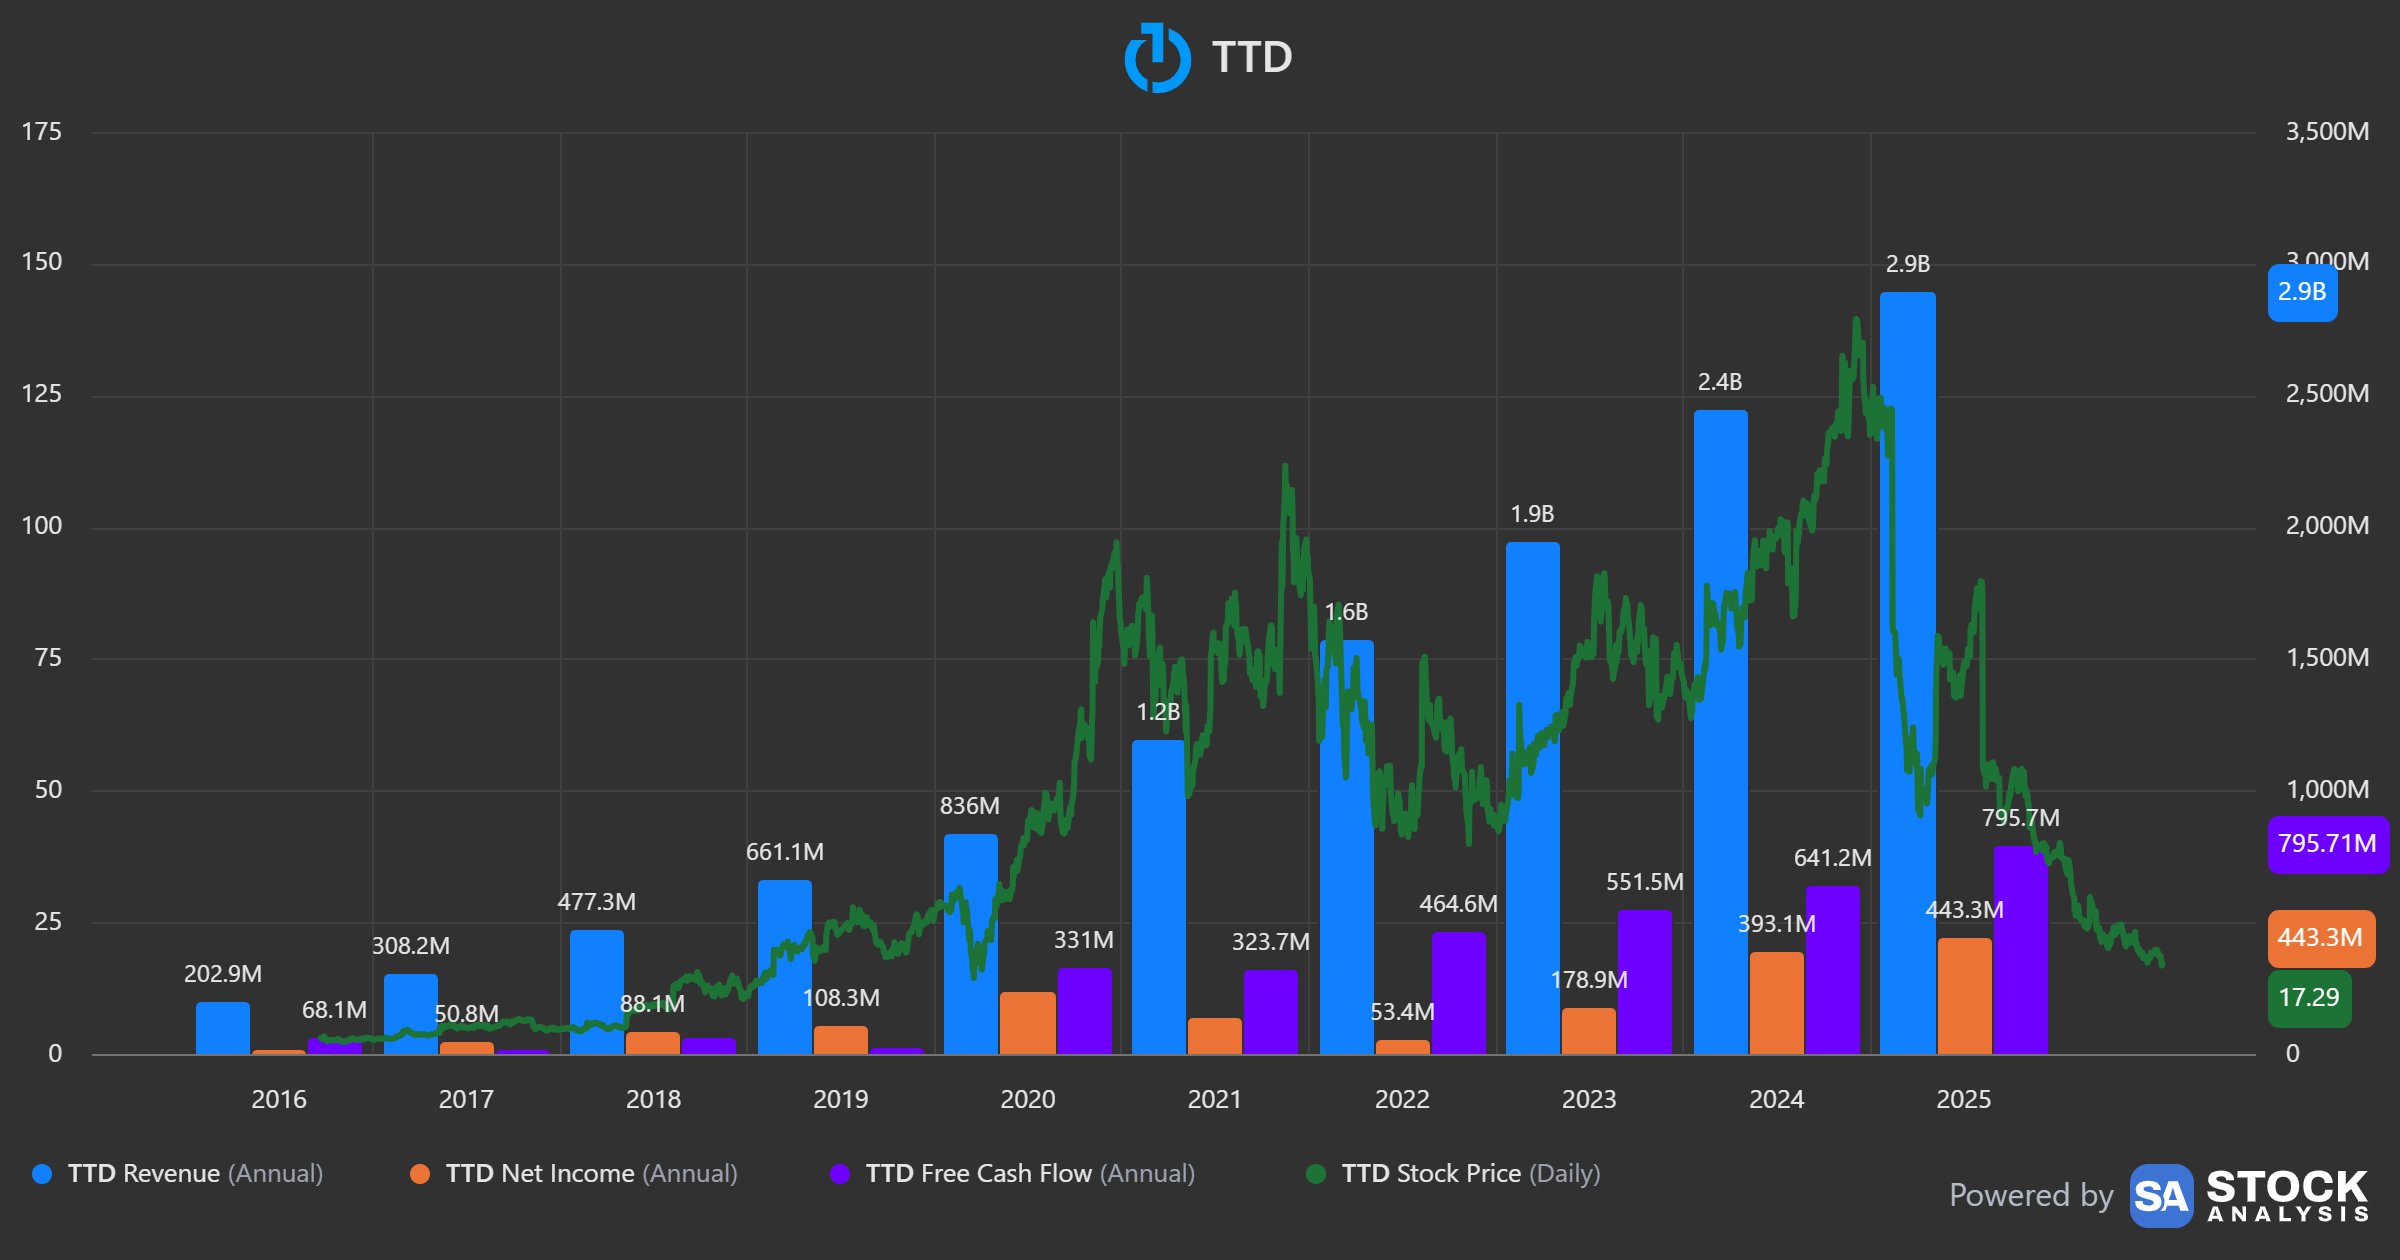
Now the part almost nobody says out loud. Through all of it, free cash flow went up. Not up once. Up every single year: $323.7 million in 2021, $464.6 million in 2022, $551.5 million in 2023, $641.2 million in 2024, $783 million in 2025. Revenue compounded from $1.2 billion to $2.9 billion over the same stretch. Gross margins sit near 78%. There is no debt, there is $1.41 billion of cash, and $164 million of stock was bought back last quarter. A business does not print rising cash for five consecutive years while dying.
So what actually broke? Not demand. A billing dispute. In mid-March a consultant hired by Publicis concluded that Trade Desk had stacked its platform fee on top of other fees and switched client campaigns into paid features without documented sign-off. Publicis told its global clients to stop spending. 90 days later, in mid-June, both sides issued a joint statement, business resumed, Publicis restored its recommendation. In July, Dentsu made Trade Desk an inaugural partner in its new retail-data venture. Two of the six global holding companies, lost and recovered, inside one quarter. Stock's reaction to the resolution was a 3.33% bounce... then a fresh low.
Meanwhile company rebuilt its entire commercial leadership in seventeen days. A new chief financial officer in June. Then, between July 13th and July 17th: a new board director, a new chief commercial officer poached from Uber's advertising business, a chief business development officer in a newly created role, and a vice president of client strategy out of Hershey. Market has spent five months pricing the people who left. It has spent no time at all pricing the people who arrived.
My read...this is a restart being priced as an ending. Add one more fact and the shape of the trade becomes obvious. Roughly 17% of the float is sold short, company has retired 5.1% of its own shares in 12 months, and above the market-structure high there is almost no overhead supply until the March spike. Anyone who wanted out at current levels has had 11 months and a brutal tape in which to leave. Sellers higher up have to be created, not found. I am bullish, I am staging the entry around August 6th print rather than pretending I can see through it. I will show you exactly where I would be wrong.
Ian Andy, Research Desk, Bellwether Research, July 30, 2026
Anatomy of an 88% Repricing
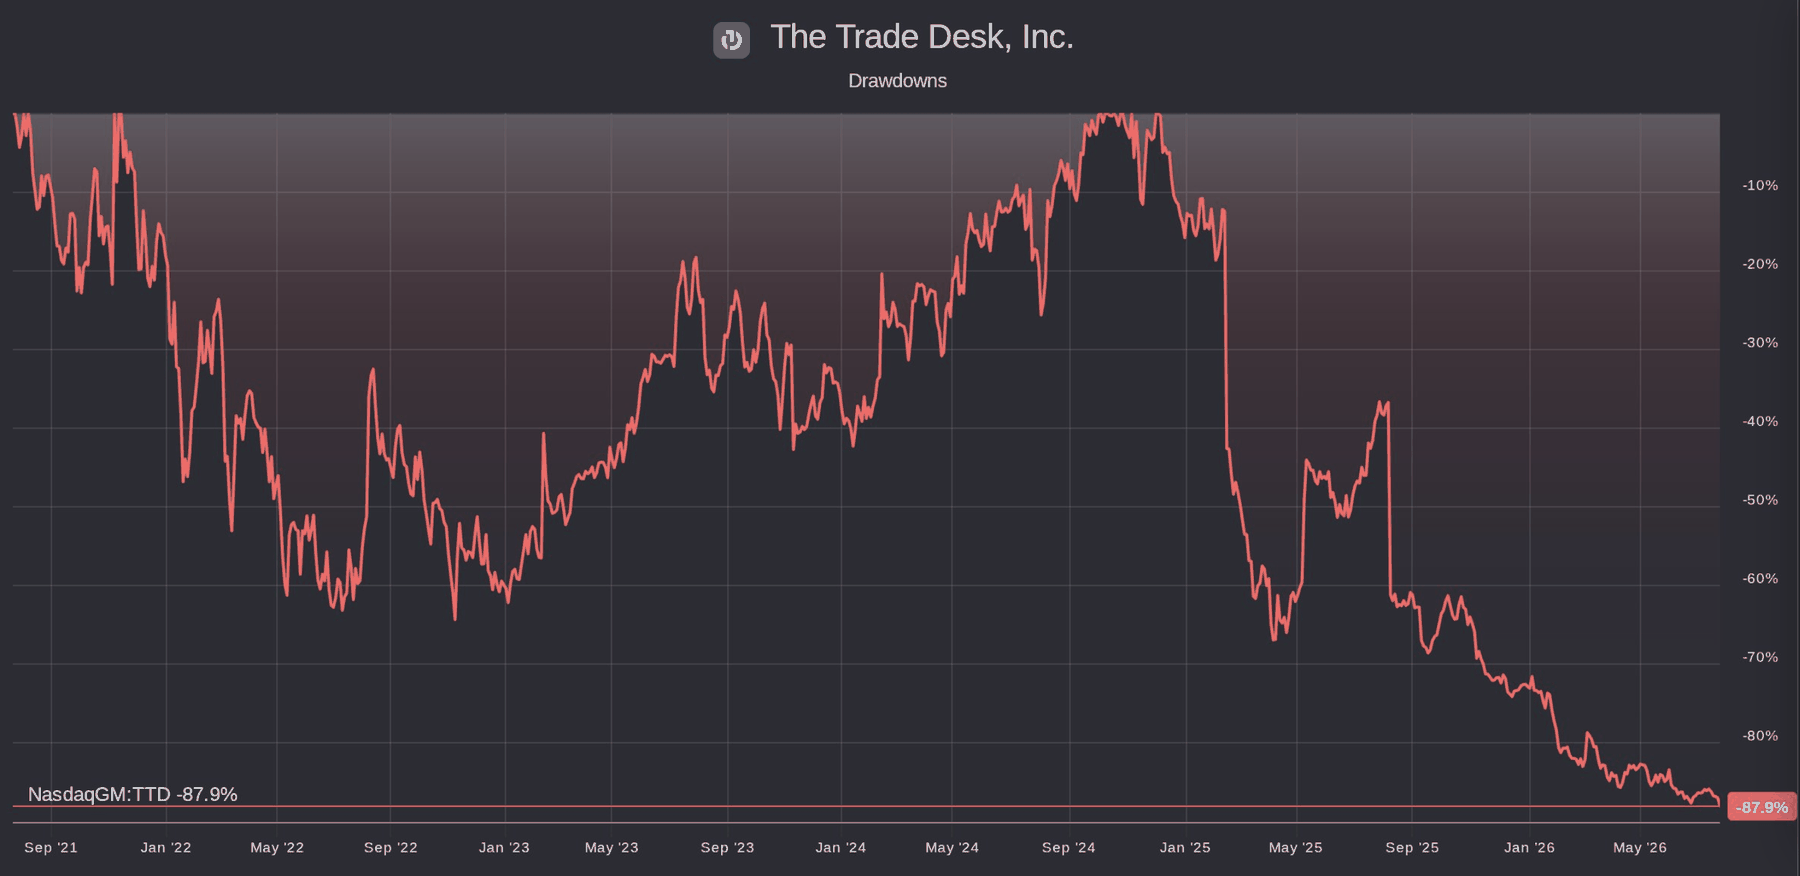
Two cliffs and a landslide. That is the shape of this chart. Reading shape matters more than reading level. February 2025 delivered the first cliff, when a company that had beaten its own guidance for 33 consecutive quarters missed. Investors had paid for metronomic reliability. Reliability was the product that failed. August 2025 delivered the second, a single session that took the stock from roughly 4% above where this 12-month window opened to 37% below it. Everything after those two events is different in character - 11 months of stair-steps, each lower, with no rally that held.
Growth genuinely decelerated. No softening that. Revenue grew 43% in 2021, 32% in 2022, 23% in 2023, 26% in 2024 and 18% in 2025. First quarter of 2026 came in at $688.86 million, up 11.82%, the fourth consecutive quarter of deceleration. Management then guided the June quarter to at least $750 million, about 8% growth. Jefferies made the sharpest observation on that guide: 8% year-on-year implies just 9% sequentially, against 13%, 19% and 21% in the second quarters of 2025, 2024 and 2023. Sequential comparisons strip out the base effects that annual growth rates hide. On that measure the slowdown is genuine.
Now the number nobody is weighing. Cash generation did not follow revenue down, it accelerated away from it. Operating cash flow in the first quarter reached $391.8 million, up 34% year on year, the strongest quarter in the company's history. Free cash flow of $276 million grew 20% even while capital expenditure nearly doubled to $112.7 million on platform and AI infrastructure. Adjusted EBITDA held at $206 million. A company whose demand was collapsing would not be converting a decelerating top line into record operating cash.
Valuation moved further than either the growth or the cash. Forward enterprise value to EBITDA compressed from roughly 28 times in mid-2025 to about 5.4 times on next year's numbers. Price to sales fell from a five-year average near 20 times to roughly 3 times. Put plainly, in 12 months the market went from paying for a compounder to paying less than the sector median for a business still growing faster than its own peer group. In the same first quarter, DoubleVerify grew 9.6% and PubMatic shrank 2%. Trade Desk's disappointing 11.8% led the cohort it is supposedly losing to.
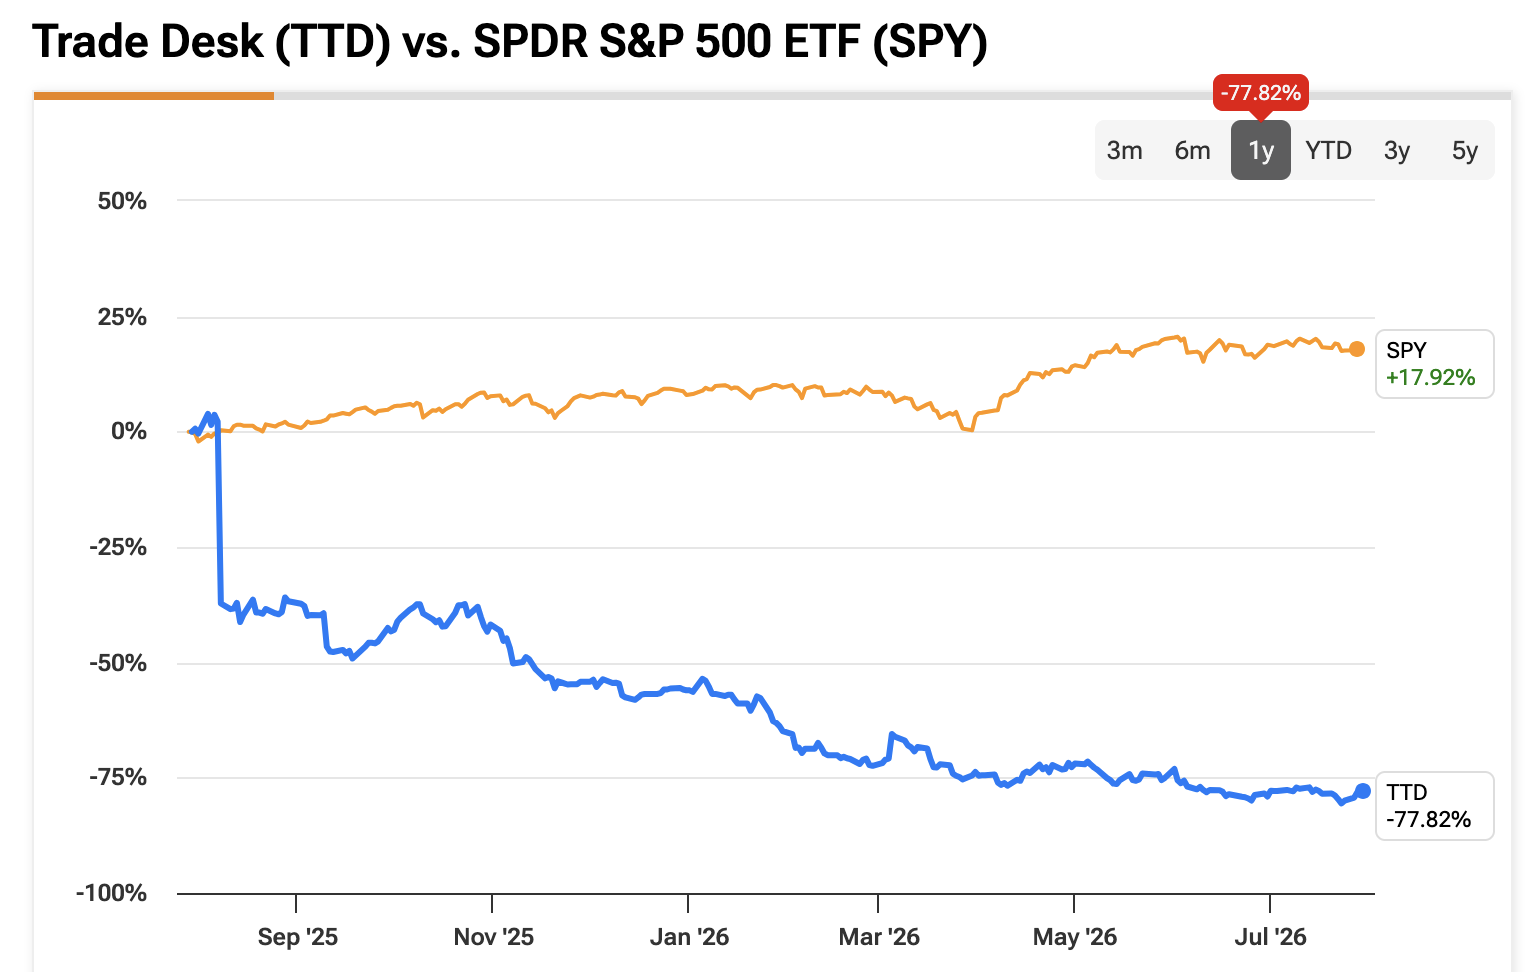
96 percentage points of underperformance in one year is not a forecast about ad budgets. It is a verdict about identity. Market decided this is an advertising business, not a software platform, then repriced it against that comparison set. Whether verdict sticks is the whole question.
Twenty Million Auctions a Second
Jeff Green and Dave Pickles founded this company in 2009 and ran its first campaign in 2011. It listed in 2016 and celebrates ten years as a public company this autumn. Today it employs more than 3,800 people across 35-plus markets from a headquarters in Ventura, California. It counts roughly 90% of the Fortune 500 among its clients. What it does is narrow and, once you see it, unusually hard to copy: it buys advertising on behalf of advertisers. It owns no advertising inventory at all.
That second clause is the business. Every walled garden sells you space it owns, which means it grades its own homework. Trade Desk sells judgement. Because it has nothing to push, that judgement is worth paying for. Green put the mechanics of that judgement on the first-quarter call: the platform evaluates 20 million advertising opportunities every second and buys somewhere between 300 and 400 of them. Two years earlier that number was 10 million per second. Throughput doubled while the share price fell by three quarters.
Underneath the pitch sit four pieces of real infrastructure. Bid factors, where every rival uses line items, let a buyer express preference on an individual impression instead of a campaign, which is why reporting across 300-plus variables is possible at all. Koa supplies the AI layer. Unified ID 2.0 is an open identity standard built on hashed emails, used by hundreds of advertisers and publishers, and governed independently instead of owned. OpenPath connects buyers straight to publishers running their own yield management. Sincera feeds inventory-quality data (ad-to-content ratio, ads in view, refresh rate) into bidding, so a buyer can pay a premium for a clean page and stop bidding on a cluttered one.
Green was asked directly on the call whether it made sense to add supply-side services and shorten the chain further. His answer explains the moat better than any slide: technologically they could, but doing so would mean telling advertisers "we want you to get the lowest CPM possible" while telling publishers "we want to give you the highest CPM possible," and serving two masters is the flaw in every ad-network model. Refusing profitable adjacencies to protect neutrality is expensive discipline. It is also the only reason the product exists.
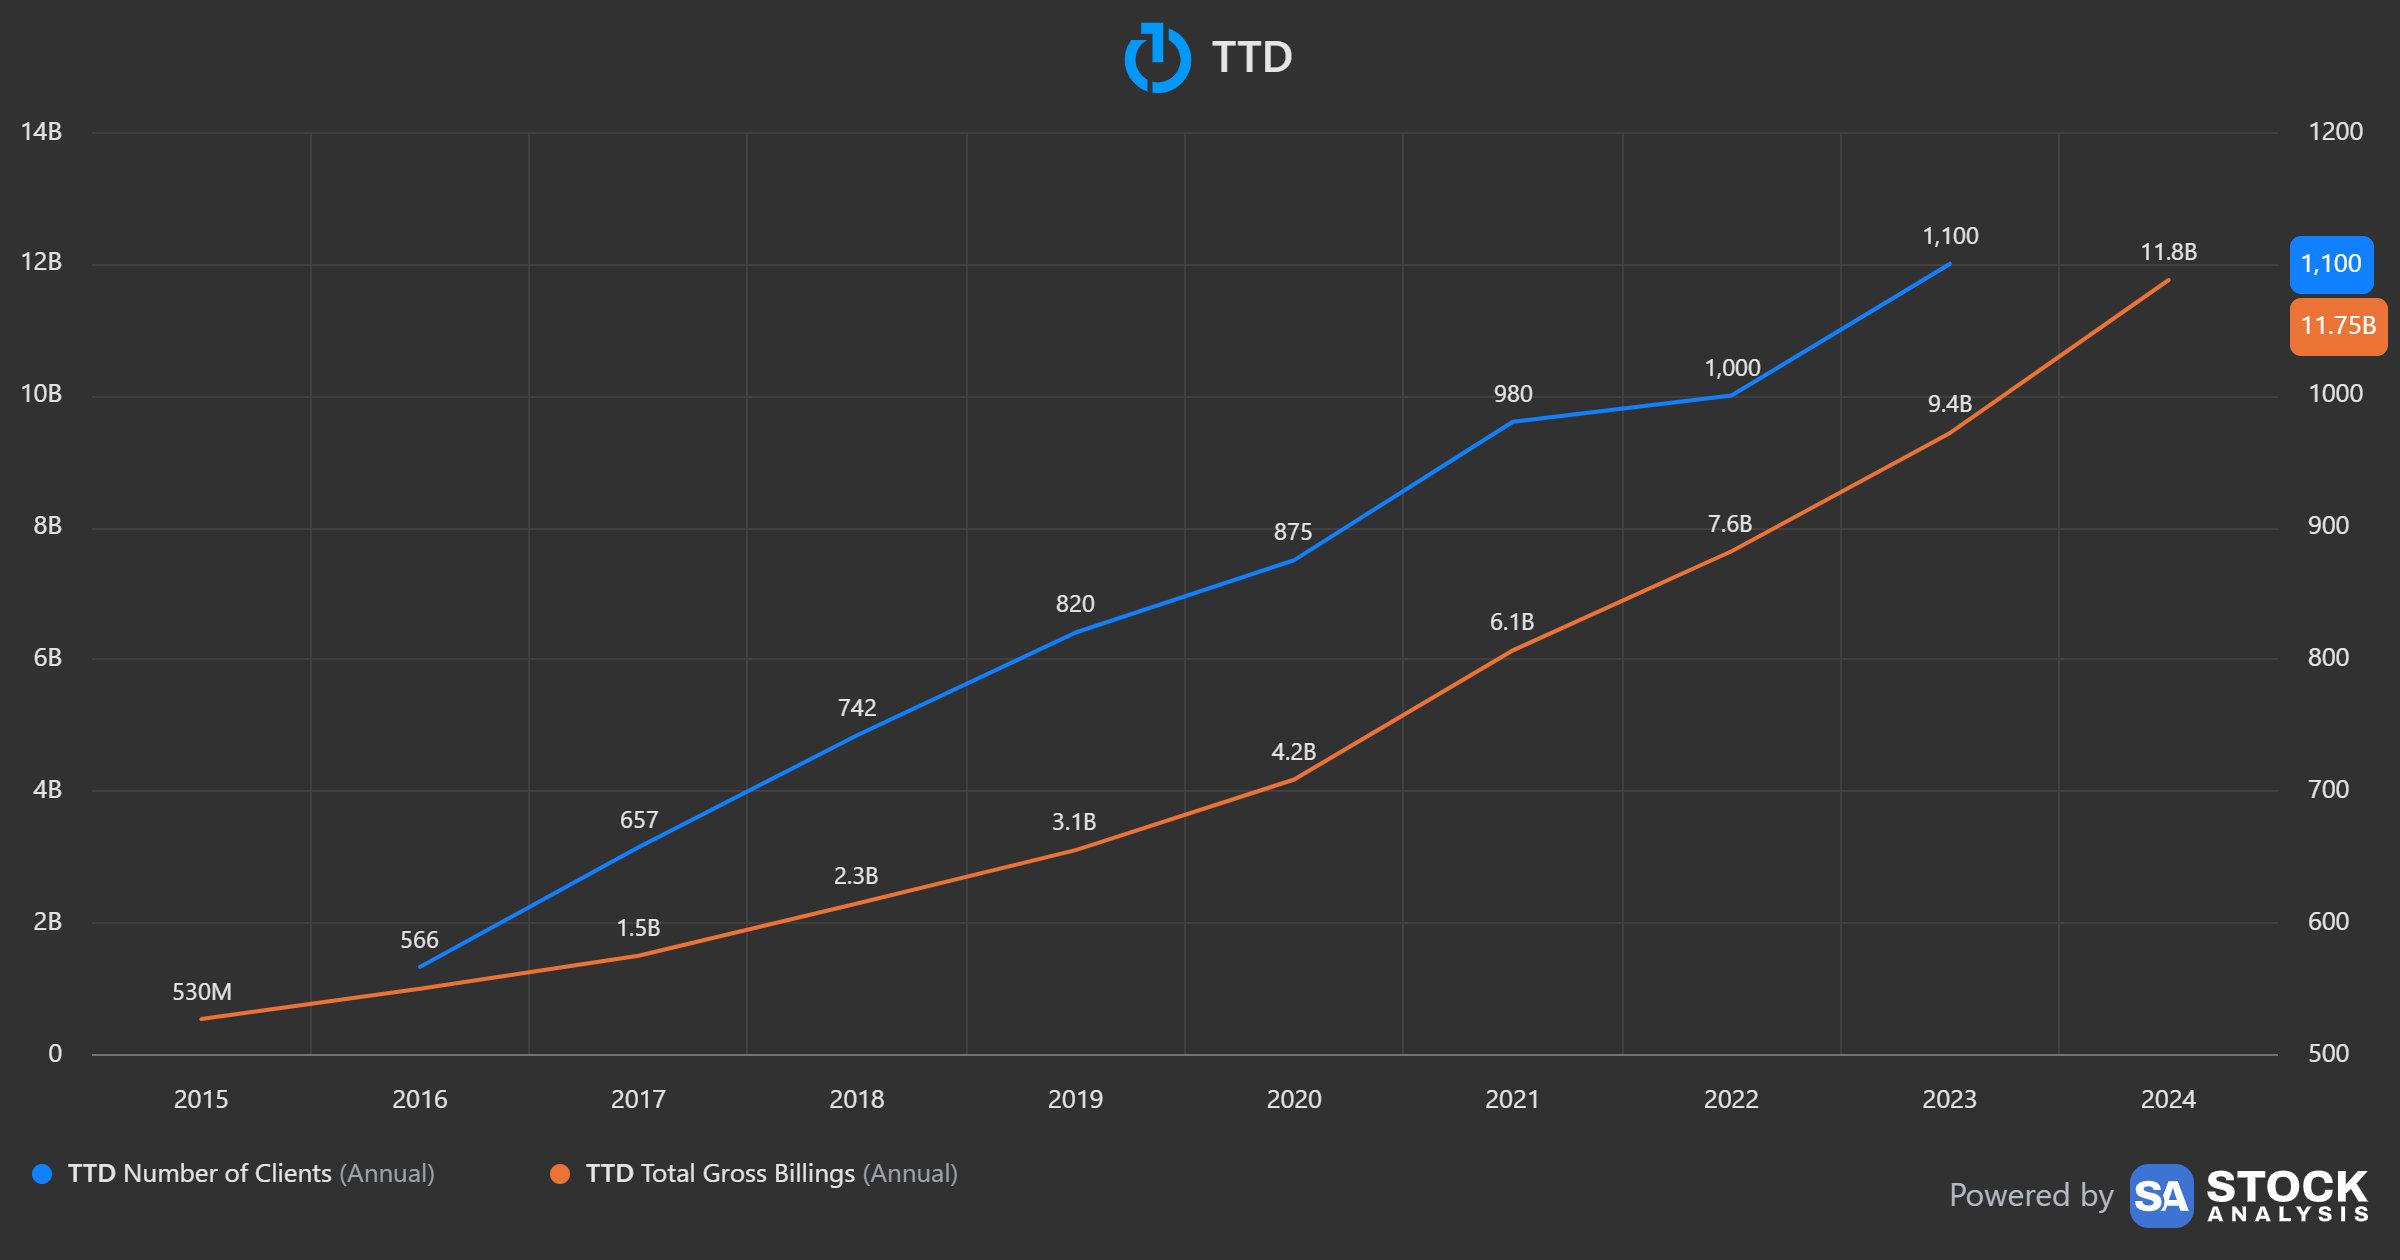
Which brings us to the number the bears aim at, correctly. Trade Desk charges roughly a 20% take rate. Amazon charges 1% on its own inventory and Google somewhere in the region of 10-15%. On the company's own supply-chain slide, of every dollar an advertiser commits, 55 cents reaches the publisher. Any honest bull case has to explain why a buyer pays that premium. Answer is not loyalty but arithmetic: if objective decisioning across 20 million opportunities a second produces better outcomes than cheap access to a narrower pool, the higher fee is still the cheaper media. Customer retention above 95%, held at that level for more than a decade, says buyers have been doing that maths and reaching the same conclusion. It also, fairly, says switching is a nuisance.
Which answers the question the previous section left open. Gross margins near 78%, a fixed cost base evaluating 20 million auctions a second whatever the campaign count, and revenue that scales on someone else's media spend... those are software economics, not agency economics. Market repriced this as an advertising business. What it actually owns is a toll booth on other people's advertising, and the toll booth kept collecting all the way down.
Important Disclaimer
This content is for informational and educational purposes only and does not constitute financial advice, investment recommendations, or solicitation to buy or sell any securities. Past performance does not guarantee future results. All investments carry risk, including the possible loss of principal. Shares of The Trade Desk, Inc. (NASDAQ: TTD) are subject to significant risks including: revenue concentration among advertising agency holding companies, two of which each exceeded 10% of business per the most recent annual filing; unknown commercial terms from the Publicis settlement, including potential take-rate concessions; competition from walled-garden platforms including Amazon, Alphabet, Meta and AppLovin; erosion of retail-data exclusivity following Walmart's addition of rival demand-side platforms; continued deceleration of revenue growth and negative operating leverage; material stock-based compensation that substantially reduces free cash flow on a fully charged basis; an elevated effective tax rate linked to the share price; significant recent turnover across the executive team and board of directors; regulatory and privacy change affecting digital identity and data activation; and the risk of further guidance revisions. Technical analysis presented reflects historical price and volume data and is not a guarantee of future movements; relative-strength, moving-average, wedge, retracement and market-structure signals are lagging or interpretive indicators with well-documented limitations, and short-interest data is periodic and may not reflect current positioning. Certain market-research statistics cited in this study were commissioned by Trade Desk and are identified as such in the text; readers should weigh them accordingly. Scenario analysis, price targets and probability weightings are based on publicly available information, independent modelling and analyst-consensus data as of July 2026; actual results may differ materially. Entry, target and stop levels reflect scenario-based analysis, not price predictions. This study publishes seven days before a scheduled quarterly earnings release, which may materially change the facts on which it relies. Always conduct your own due diligence and consult a qualified financial advisor before making any investment decision. Position-sizing guidelines are general in nature and do not account for individual circumstances, tax situations or risk tolerance.