ServiceNow just had its worst single-day selloff since IPO. Down 17.7% on April 23rd. Worst day in fourteen years. And it happened after a beat-and-raise quarter. Revenue $3.77B, subscription growth 22% year-on-year, AI commitment lifted 50% from $1.0B to $1.5B for the year, RPO at $27.7B growing 25%, 16 deals over $5M in net new ACV, renewal rate at 97%. None of that triggered the sell. What did was a Q2 operating margin guide of 26.5% versus the Street at 30.1%, a 200 bps headwind to free cash flow from the freshly closed $7.75B Armis acquisition, and a handful of on-premise deals slipping in the Middle East as Iran tensions delayed sovereign cloud closings.
Here is what the price tells you the business is doing: it is broken. Here is what the business is actually doing: NOW Assist customers spending over $1M in ACV grew 130% year-on-year, 50% of net new revenue now comes from non-seat-based pricing, and Moveworks delivered more deals in Q1 alone than it did in all of 2025. Bill McDermott told analysts that the goal of $1B in AI commitments for the year was "understated". They are already at $1.5B and on a run. Yevgeny Dibrov, CEO of Armis, joins the team to run security. ServiceNow now sits inside 9 of the world's 10 largest companies, and roughly 40% of the Fortune 100, via Armis alone.
Scenario entry zone $84–$88 reflects forward P/E of roughly 20x against a 5-year median of 64x, a 68% discount to its own history, cheaper than Microsoft, Oracle, and SAP despite faster top-line growth. At GuruFocus' GF Value of $223, NOW is flagged as "significantly undervalued" for the first time in the company's modern history. Wall Street consensus from 47 analysts sits at $143.40 average, with high of $240 and low of $85. Market is pricing a structural break in software while ServiceNow's underlying business reaccelerates. That is the dislocation. That is the trade.
Key Metrics at a Glance
Numbers above describe a SaaS business operating at scale most peers can only target on a roadmap. A $15B subscription revenue base compounding above 20% per year. Operating margin at 32%, eleven points higher than five years ago. Free cash flow margin at 44% in Q1. Remember, Q1 is the seasonal high, so the full-year 35% guide is the cleaner read. Rule of 56 number management quotes is real: revenue growth plus FCF margin lands at 56.8 on trailing twelve months, well above the Rule of 40 benchmark McKinsey uses to define elite software.
What matters more than any single Q1 figure is the shape of contracted backlog. RPO at $27.7B growing 25% is contracted revenue customers have already committed to pay, and it is growing faster than recognised revenue, which means the pipeline of future revenue is widening, not narrowing. Software in structural decline does not have backlog accelerating. Software losing seats to AI does not see 28 new customers cross the $5M annual spend line in a single quarter while renewal rates stay glued to 97%.
One number I keep returning to: 50% of net new business in Q1 came from non-seat-based pricing: tokens, infrastructure, hardware, connectors. A year ago, that figure was barely measurable. ServiceNow has executed the single most important pricing pivot in enterprise software. While Wall Street debates whether AI kills the seat model, ServiceNow has already moved past it. Half the new business is structurally usage-priced. Rather than a company exposed to AI disruption, this is a company monetizing the same trend that is supposedly disrupting it.
What ServiceNow Actually Is ... and Why It Cannot Be Vibe-Coded
Biggest misunderstanding in this whole AI-disruption discourse is treating ServiceNow as a CRM clone or a help-desk ticketing app. That framing is so wrong it borders on malpractice. ServiceNow is not a feature. It is connective tissue.
An average Fortune 500 company runs on roughly 100 million lines of custom code stitched across hundreds of point applications, three or four hyperscaler stacks, dozens of SaaS vendors, several systems of record, and an explosion of homegrown tools. ServiceNow sits above that chaos and orchestrates the workflow between humans, agents and software. McDermott calls it the "AI control tower for business reinvention." Customers call it the "ERP for IT." Pick your label. Functionally, it is the rail on which work moves inside a global corporation.
"There has never been a tailwind for ServiceNow like AI. Since Fred Luddy started the company, we've always focused our platform on the jobs our customers needed done... As code volume increases 20x by 2030, the complexity of managing this explosion of code will increase exponentially. Volume of tickets generated by this complexity will also explode. In this scenario, the number of tickets hitting an ITSM system will increase by 50x compared to today."
Bill McDermott, Chairman & CEO, ServiceNow Q1'26 Earnings Call, April 22 2026Context Engine is what makes that defensible. ServiceNow has trained on more than 95 billion annual workflows and 7 trillion transactions across 22 years inside the world's most regulated, most complex enterprises. Approval chains. Cost thresholds. Vendor histories. Asset dependencies. Identity relationships. Compliance rules. None of that lives in a foundation model. None of it can be inferred from a public corpus. A large language model is brilliant at generating language. ServiceNow knows which approval chain applies when a $50,000 procurement request from a German subsidiary touches an asset that is subject to GDPR and tied to a vendor on the export-control list. Foundation models do not. They cannot.
That is also why "vibe-coding" the replacement does not work. A start-up can spin up a chat interface in a weekend. It cannot replicate two decades of accumulated enterprise context, a network of integrations into SAP, Workday, Salesforce, ServiceNow's own CMDB, and a 200,000-customer install base. Customer base is the moat. Data flywheel is the moat. AI is the accelerant, not the assassin.
Platform now spans five hypergrowth surfaces management called out on the call: core IT (ITSM, ITAM, ServiceOps), AI security via Armis + Veza, AI-native CRM, EmployeeWorks as the conversational front door, and Workflow Data Fabric. Each is large enough to be a stand-alone public company. All sit on a unified data layer and a single Context Engine. That is the structural advantage hyperscalers and language model companies cannot match, and it is precisely what the current selloff ignores.
A Beat-and-Raise Quarter, Worst Single-Day Drop Since IPO
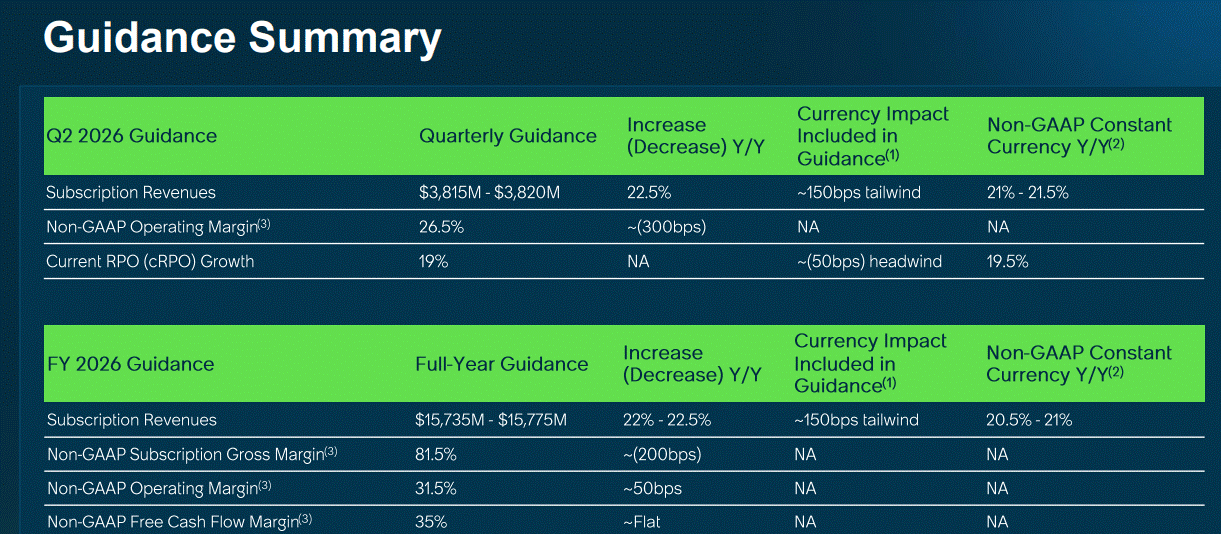
Let me lay out what actually happened on April 22nd, after-hours. ServiceNow reported Q1 FY26 revenue of $3.77B (consensus $3.75B), non-GAAP EPS of $0.97 (consensus $0.97), and beat its own subscription revenue guide at the high end. Non-GAAP operating margin came in at 32%, fifty basis points above guidance. FCF margin at 44%. Subscription revenue guide for the full year was raised by $205M at the midpoint to $15.735–$15.775B. AI commitment for the year was raised 50% from $1.0B to $1.5B. Renewal rate held at 97%.
Stock closed Wednesday at $103.07. It opened the next morning trading near $83. Intraday low touched $83.58. Down 17.7% on the day. Worst single-day selloff in ServiceNow's history since the June 2012 IPO. Volume hit the highest since late 2019, before the pandemic. By any reasonable measure, this was a capitulatory event. And by any reasonable measure, the reaction was wildly disproportionate to what was reported.
So what triggered it? Three things, in order of weight:
First, Q2 operating margin guidance came in at 26.5% versus a Street expectation of roughly 30.1%. That gap is real. Driver is the freshly closed $7.75B Armis acquisition, a 125 bps headwind to Q2 operating margin, 75 bps to full-year operating margin, 25 bps to subscription gross margin, and 200 bps to full-year free cash flow margin. None of that was a surprise to anyone reading the acquisition announcement. But the market interpreted Armis dilution as a sign that ServiceNow is "buying growth" because organic is decelerating. That framing is uncharitable. Excluding Armis, management held the full-year subscription guide flat at the prior level despite delayed Middle East deals. Holding flat in this macro reflects execution under stress, not deceleration.
Second, delayed on-premise deals in the Middle East represented a 75 bps headwind to Q1 subscription revenue. Iran war pushed several sovereign cloud closings out of the quarter. Those deals are sovereign clouds, recognised as on-premise revenue, so the impact is lumpy. It hits all at once instead of ratably. Management said the conversations are active, people are back in their offices, and a few of those on-prem deals already closed in Q2. CFO Mastantuono explicitly noted that the full-year guide does not assume the Middle East situation resolves. Reads as conservative guiding rather than deteriorating fundamentals.
Third, and most telling, Anthropic's ARR run-rate hit $30B during the quarter, up from $9B at the end of 2025. That spike triggered a sector-wide panic that AI labs are eating SaaS budgets and seat-based pricing is dead. Software ETF IGV is down 9% YTD. NOW is down 57% from the January 2025 high. Adobe is down nearly 30%. Salesforce is down too. Market is pricing a sector reset, not a ServiceNow-specific deterioration. That is why I find the entry asymmetric. Selloff is index-driven sentiment, not name-specific data.
One detail worth lingering on. Bill McDermott has been doing earnings calls for over twenty years across SAP and ServiceNow. His tone on this call was notably defiant rather than defensive. Quote: "In the short run, markets are voting machines. And right now, uncertainty is winning the vote. But don't worry. In the long run, they are weighing machines. And I'll tell you, I'll get on that scale with that ServiceNow brand on my chest any day." Translation: management is unflinchingly confident, the Board is supportive, the Financial Analyst Day on May 4 in Las Vegas will be the next opportunity to reset narrative. McDermott also gave an early headline (the $1.5B AI commit number) that he openly admitted was supposed to be reserved for FAD. That is not the posture of a CEO worried about the trajectory.
$27.7B Backlog, 630 Whales, 97% Renewal – Anatomy of a Sticky Business
Three signals tell you whether an enterprise software business is healthy beneath the headline revenue line: backlog growth, top-cohort customer expansion, and renewal rate. ServiceNow puts up best-in-class numbers on all three at the same time.
Remaining Performance Obligations (the dollar value of contracted revenue not yet recognised) closed Q1 at $27.7 billion, growing 25.3% year-on-year on a constant currency basis. Current RPO (the portion due within twelve months) reached $12.64 billion, up 22.6%. That is backlog growing faster than recognised revenue. Customers are signing longer, larger contracts before the cash even hits the income statement. Software facing AI disruption does not see this pattern. Customers nervous about future relevance shorten contracts and demand consumption-only terms. ServiceNow's customers are doing the opposite.
Top-cohort customer count is the second tell. Customers paying ServiceNow more than $5 million annually grew to 630 in Q1, up 22% year-on-year from 516. Twenty-eight new customers crossed that threshold in a single quarter. Five additional customers crossed the $50 million annual mark versus a year ago. Largest net new logo deal in company history closed at over $15 million in net new ACV. Sixteen deals over $5 million in net new ACV in the quarter. Five over $10 million. Software that customers want to leave does not see this kind of expansion at the top of the cohort pyramid.
Renewal rate held at 97%, including the Moveworks customer base, which converted in. That is roughly the theoretical ceiling for enterprise software. There is no meaningful churn happening. If AI was hollowing out seat counts the way bears claim, renewal would crack first. It is not cracking. Average ACV per $5M+ customer rose 4.9% to $14.9 million. Existing customers are buying more, not less.
Multi-product attach is the third signal. Seventeen of the top twenty deals in Q1 included seven or more ServiceNow products. That is the platform thesis in action: customers buy one workflow module and then expand across IT, HR, CRM, security, and creator workflows because the data layer underneath is shared. Switching out becomes structurally harder with each additional product. New logo ACV growth accelerated to over 50% year-on-year. Sales CRM net new ACV quintupled. Industry-specific workflows saw transportation and logistics ACV grow 280% YoY, financial services 65%, energy and utilities 45%. Rather than a maturing one-trick business, this is a platform that keeps adding doors.
From Sidecar to Embedded – How NOW Is Actually Selling AI
There is a fork in the road of every enterprise software story right now. On one side: companies sell AI as a separate SKU bolted onto a legacy platform. On the other: companies redesign their entire product surface to be AI-native, with intelligence woven into every workflow. Sidecar versus embedded. ServiceNow has chosen embedded. And the numbers say customers are paying for it.
Headline metric is the AI commit target. Heading into 2026, ServiceNow guided to $1 billion in annual contract value tied to AI capabilities. Already aggressive. On the Q1 call, management raised it by 50% to $1.5 billion. Not because of a methodology change. Same definition, same measurement: only the incremental contribution tied to AI capabilities counts. Mastantuono was explicit on this point. They are simply hitting the goal faster than they thought possible.
Underneath the headline, the cohort detail is what matters. Customers spending over $1 million in ACV on Now Assist grew over 130% year-on-year. Deals with three or more Now Assist products grew nearly 70% YoY. Thirty-six deals with five or more Now Assist products in Q1 alone. Deal volume on AI Control Tower more than doubled quarter-on-quarter in average deal size. RaptorDB Pro, ServiceNow's high-performance database for AI workloads, grew deal volume 80% YoY with five deals over $1 million. None of these were one-off pilots. This is enterprise-wide AI deployment, rather than an experimentation.
"Customers are moving past experimentation into full-scale enterprise-wide AI investment... 50% of net new business now comes from a non-seat-based pricing model, including tokens and other assets such as infrastructure, hardware and connectors. Our hybrid pricing model gives customers the best of both worlds: predictable foundational seat licenses combined with usage-based scalability. It's the freedom to scale AI adoption without a friction that the customers love."
Gina Mastantuono, President & CFO, ServiceNow Q1'26 Earnings CallThat 50% non-seat figure is the single most important pricing data point in the entire SaaS sector right now. Anthropic, Stratechery, every AI-disruption bear has built their thesis on the death of seat-based pricing. ServiceNow has already shifted half its new business off seats. Tokens, hardware, connectors, infrastructure, hybrid bundles. Pricing model is evolving in real time, faster than the bear thesis can adapt and ServiceNow is growing through the transition rather than being crushed by it.
Architectural piece behind the AI monetization is something ServiceNow announced this quarter: end of the AI add-on. AI capabilities are now embedded across every commercial tier: Foundation, Advanced, and Pro Plus all ship with AI built in. That is a deliberate break from the sidecar model. Customers do not have to make a separate purchase decision; they simply consume more as they discover value. McDermott described this as moving from "land and expand" to "control and compound." Marketing language, yes. But the underlying logic, that pricing follows consumption follows context follows compounding workflow density, is exactly how Adobe, Microsoft, and Salesforce all built durable AI businesses in prior tech waves.
Most underrated piece of the AI story: Now Assist's track record of being measurable. Many AI-vendor metrics are vapor. ServiceNow's AI commit measures only the incremental ACV attributable to AI capabilities, audited by the same finance function. There is no double-counting. There is no marketing math. When McDermott says $1.5B in AI commitments, he means $1.5B that would not have closed without the AI layer.... a rare honesty in a category drowning in fluff.
Armis & Veza – Security Becomes a Pillar
Largest M&A move in ServiceNow's history closed days before the Q1 earnings call: the $7.75 billion all-cash acquisition of Armis, the cyber asset intelligence platform that already sits inside 9 of the world's 10 largest companies and roughly 40% of the Fortune 100. Veza, the identity-governance platform acquired for $1.2 billion, closed in mid-March. Moveworks, the AI-assistant platform, was acquired in December 2025 for $2.4 billion and has already been rebuilt into EmployeeWorks. Pyramid Analytics, Data.World, Logik.io, Traceloop. Eight acquisitions in eighteen months totaling north of $12 billion.
Bears will tell you ServiceNow is buying growth to mask organic deceleration. I think that read misses the architecture. Each of these acquisitions plugs a specific gap in the AI control tower thesis. Armis adds real-time asset visibility across IT, OT, IoT, and medical devices, the unmanaged surface that is exploding as AI agents proliferate. Veza adds dynamic identity governance for humans, machines, and AI agents. McDermott described it as "Active Directory for AI agent identities." Moveworks adds conversational AI as the employee front door. Pyramid adds AI-powered analytics. Together, ServiceNow becomes a unified security, identity, workflow, and analytics layer. Not a workflow tool with security bolted on.
"Armis is going to be our Instagram, and I'll tell you why. The #3 economy in the world is cybercrime. It's $1 trillion a month. We now have a situation where on the IT and the OT landscape of every major corporation, we are managing the agents and the humans, and we are managing the landscape of the threat actors. And if you think about a single intrusion from an AI agent will cost a commercial customer $5 million and a public sector customer $10 million, you have to look to ServiceNow quickly... So you're looking at a tailwind here that has — I've never seen it. So get ready for major revenue acceleration."
Bill McDermott on Armis, Q1'26 Earnings CallMargin headwind from Armis is real and worth being honest about. Q2 operating margin guide of 26.5% includes 125 bps of Armis drag. Full-year 31.5% operating margin guide includes 75 bps drag. FCF margin guide of 35% includes 200 bps drag. Subscription gross margin guide of 81.5% includes 25 bps drag. Those are the costs of integration. Management explicitly said operating margin and FCF margin will normalize and expand again in 2027 and beyond. Mastantuono went further on the call: by year-end, the 50 bps run-rate margin headwind from Armis is expected to go to zero thanks to internal AI efficiency gains from "Now on Now": the company eating its own dogfood to automate IT operations.
That second point matters more than the first. ServiceNow runs ServiceNow on ServiceNow. Their internal IT organization deflects 70% of employee requests before any human agent touches them. They have already eliminated 2,200 monthly manual hours via EmployeeWorks. Now Assist resolves 90% of internal IT cases, with agents 99% faster than human counterparts. McDermott told analysts they have captured $500 million in productivity savings internally on the back of those efficiencies. Company exiting 2025 into 2026 with flat headcount while growing revenue 22% is the proof point. Margin headwind from Armis gets absorbed by AI efficiency gains the company is generating against itself.
Cybersecurity also explains why I think ServiceNow is buying optionality, not buying revenue. Armis is small in dollar terms. Full-year contribution is roughly 125 bps to subscription growth (call it $190M against a $15.7B base). They are buying the architecture, the customer relationships (9 of the world's 10 largest companies), and the strategic positioning. ServiceNow's existing security business already crosses $1B in ACV. Layer Armis asset visibility plus Veza identity governance on top of that, push it through a global sales force ServiceNow has and Armis did not, and you get one of the few credible end-to-end security platforms outside CrowdStrike and Palo Alto. Cyber is becoming a fifth pillar of ServiceNow, on its way to a billion-dollar standalone business inside the platform.
Income Statement Anatomy – Where Each Dollar Goes
Whenever the AI-disruption narrative pulls a quality SaaS name down 50%+, I find it useful to step away from forward multiples and look at the actual income statement. Where does each revenue dollar end up? What does the cost structure look like? Is the business funding itself or burning cash?
Walk the flow. Q1 revenue of $3.8 billion. Cost of goods sold consumes $940 million (24.9% of revenue), leaving $2.8 billion in gross profit at a 75.1% GAAP gross margin. Out of that, the company spends $1.5 billion on SG&A (roughly 40% of revenue, heavy because ServiceNow runs an expensive direct enterprise sales force calling on Fortune 2000 accounts) and $823 million on R&D (21.8% of revenue, that is the AI investment, the platform engineering, the Context Engine and Now Assist build-out). Operating income of $503 million on a GAAP basis (13.3% margin). Add $82 million net interest income and $88 million other income, subtract $204 million in tax (30.31% effective rate), and you land at $469 million in GAAP net income. A 12.4% bottom line.
A few things jump off the page. First, the R&D spend at 21.8% of revenue is heavy by mature-software standards. Microsoft is closer to 13%, Oracle around 13%, Adobe near 17%. ServiceNow is reinvesting at a higher rate because the platform is still in expansion mode, building Context Engine, AI Control Tower, RaptorDB Pro, Workflow Data Fabric, the entire AI-native architecture. Investors who fixate on near-term margin compression miss the fact that this R&D base is what generates the multi-year competitive position.
Second, the sales engine cost. SG&A at 40% reflects the cost of selling to the largest, most demanding enterprises on earth. Accounts where deals require six to twelve months of pre-sales engineering, multi-stakeholder negotiation, and bespoke implementation. That cost structure is exactly why competitive moat is durable. Smaller competitors cannot afford to sell at this scale. Vibe-coded AI alternatives have no go-to-market presence in the Fortune 500.
Third, and this is what gets lost in the post-earnings panic, the non-GAAP operating margin of 32% sits above the 13.3% GAAP figure mainly because of stock-based compensation. SBC at roughly 14% of LTM revenue is high and a legitimate criticism. I steel-man it in the bear section. But ServiceNow is buying back stock aggressively: 20.1 million shares repurchased in Q1 alone for $2 billion, with $4.2 billion authorization remaining. Share count is flat year-over-year at 1.04 billion. Net cash position is strong even after the $7.75B Armis cash deal. Net debt to adjusted EBITDA of 0.64x in Q1, down from 1.13x a year ago. Capital structure is healthy.
Free cash flow generation is the cleanest summary metric. ServiceNow generated $4.81 billion in trailing-twelve-month free cash flow as of Q1, up 30% sequentially. Management guides $5.5 billion for full-year FY26. Against a market capitalization that has compressed to roughly $90 billion at $87/share, that is a free cash flow yield approaching 6%. A 22% top-line grower throwing off a 6% FCF yield is not a structurally broken business. It is a mispriced one.
Lowest Multiple Since IPO – A 68% Discount to Five-Year Average
Let me give you the full multiples table. NOW at $87 trades at roughly 20x forward earnings (FY27 consensus EPS of ~$5.01) and 21.8x forward earnings on FY26 ($4.13). EV/Revenue sits near 5.5x on FY26. EV/EBITDA around 18x. Free cash flow yield about 5.9%. PEG ratio on 3-year forward growth of roughly 1.12x.
Now anchor those numbers against history and peers. ServiceNow's five-year average forward P/E is 63.67x. Ten-year mean 71.39x. Peak in late 2024 was over 74x. Today's forward multiple is the lowest in the company's modern history. A 68% discount to the five-year average and the cheapest the stock has ever been since IPO in June 2012. Against the sector median forward P/E of 24x, ServiceNow now trades at a discount despite growing top-line 2.1x faster than the median. Against named peers: Microsoft 22.9x, Oracle 23.5x, SAP 21.0x, Salesforce 13.5x, Workday 11.4x. Yes. NOW is now cheaper than Microsoft and Oracle on forward P/E despite growing twice as fast and operating at a higher margin profile.
GuruFocus' fundamental fair-value model, which weights historical valuation multiples, business quality, and projected earnings, flags NOW at $223.41 with the rare "Significantly Undervalued" tag. I do not anchor on a single model's price target, but it is worth noting that this is the first time in NOW's modern history the company has triggered that classification. Stocks that fundamentally do not deserve their valuation rarely show up significantly undervalued on a quality-adjusted DCF model.
Sell-side consensus tells the same story. Of 48 analysts covering NOW, 43 carry a Buy or Overweight rating, 4 Hold, only 1 Sell. And that breakdown has been remarkably stable through the selloff. Average twelve-month price target stands at $143.40, with a high of $240 (Goldman Sachs, Loop Capital) and a low of $85 (the lone bear). Average implies roughly 65% upside from the $87 current price. Both Morgan Stanley's Keith Weiss and JPMorgan's Mark Murphy questioned management on the call about when investors get to see "AI Lab-like" growth, suggesting analyst patience with the AI commit ramp; both still maintain Buy ratings into the May 4 Financial Analyst Day. Goldman's Gabriela Borges asked the most prescient question (whether AI value capture will pressure pricing on the classic stack), and McDermott's answer (innovation reinvigorates the core) is exactly what you want to hear from a CEO whose stock is being repriced down.
One final way to triangulate. Apply a deliberately conservative forward multiple of 28x to consensus FY27 EPS of $5.01, still well below the 5-year mean of 63x and a hair below peer leader Microsoft. You get a fair value of $140 per share. Apply a slightly more generous 32x and you get $160. Apply the 5-year peer P/E mean of 37x and you get $185. The base case target of $145–$155 in this tip sits within that range, anchored by a 9–12 month timeline that captures the FY26 print, the FAD long-range plan, and at minimum the first datapoint that Armis is accretive rather than dilutive.
What Bears Get Wrong – Six Attack Vectors vs. Reality
I will not pretend the bear case is empty. Some of it is well-constructed. Below are six vectors I hear most often. Five I think the data neutralizes. One deserves an honest partial concession.
"AI labs like Anthropic and OpenAI are eating enterprise software budgets. Anthropic went from $9B to $30B ARR in one year. ServiceNow is the next casualty."
Anthropic's ARR growth is real and is genuinely category-defining. But customer spend on Anthropic is incremental, not substitutive. CIOs are not replacing ServiceNow's workflow stack with a chat completion endpoint. Mastantuono said it directly on the call: AI lab spend is coming from net-new technology budget, labor reallocation, and elimination of point solutions. Not from ServiceNow's line item. 130% YoY growth in $1M+ Now Assist customers, the $1.5B AI commitment ramp (50% above original target), and 50% of net new business now non-seat priced all reinforce that ServiceNow is monetizing the same wave. Foundation models do not have enterprise context, ServiceNow does.
"Seat-based pricing is dying. ServiceNow is structurally exposed to a per-seat business model that AI will compress."
Already moved past this. 50% of net new business in Q1 came from non-seat-based pricing: tokens, infrastructure, hardware, connectors, consumption-based contracts. A year ago that figure was barely measurable. Management calls this a "hybrid" model, and it is working: customers get predictable seat licenses for foundational workloads plus usage-based scalability for AI consumption. NOW is monetizing the pricing transition, not being crushed by it. McDermott's quote ("you'll be happy to know that 50% of net new business now comes from a non-seat-based pricing model") was the single most underappreciated data point of the entire earnings call.
"ServiceNow is buying growth. Armis, Moveworks, Veza, Pyramid, they're masking decelerating organic numbers with $12B+ of inorganic revenue."
Mostly wrong, and worth unpacking. Full-year subscription guide includes 125 bps from Armis. Call it roughly $190M against a $15.7B base. Excluding Armis, management held the full-year guide flat at the prior level despite the Middle East deal slippage. That is not a company papering over organic deceleration. Moveworks delivered more deals in Q1 alone than in all of 2025 once it was plugged into ServiceNow's go-to-market machine. That is the synergy thesis playing out fast. Veza and Pyramid are too small to move the needle on revenue but matter strategically for the AI control tower architecture. Acquisitions are buying optionality and architecture, not revenue.
"Margins peaked. Q2 operating margin guide at 26.5% is far below the Street's 30.1% expectation. High-margin SaaS phase is over."
This conflates a temporary integration headwind with a structural margin reset. Q2 26.5% includes a 125 bps drag from Armis. Full-year operating margin guide of 31.5% includes a 75 bps Armis drag. By management's own statement, operating margin and FCF margin will normalize and expand again in 2027. McDermott explicitly committed that the 50 bps run-rate Armis drag goes to zero by year-end via internal AI efficiencies. ServiceNow runs at 32% non-GAAP operating margin today, eleven points higher than five years ago. Margin story is multi-year expansion punctuated by a single-year Armis integration year. Management is signaling Rule of 60 territory beyond 2027.
"Stock-based compensation is 14% of revenue. Adjusted profitability is fiction. Shareholders are being silently diluted."
This one is fair and deserves an honest answer. SBC at roughly 14% of LTM revenue is genuinely elevated and dilution would be real without aggressive buybacks. ServiceNow has been offsetting that dilution: 20.1 million shares repurchased in Q1 alone for $2B, $4.2B authorization remaining, share count held flat year-on-year at 1.04B. Trailing twelve-month SBC of $2.03B is fully covered by trailing FCF of $4.81B. McDermott committed publicly to bringing SBC down to single-digit percent of revenue, a multi-year glide path. Trend matters: SBC as a percent of revenue has been declining as the revenue base scales. Not a clean answer. But not a thesis-breaker either. Partial concession: anyone valuing NOW on GAAP earnings needs to be aware that GAAP operating margin is closer to 13% than 32%, and the gap is the SBC adjustment.
"Middle East exposure is meaningful. EMEA is 26% of revenue. Iran war is not over. Deals will keep slipping."
Real risk, contained impact. Q1 Middle East slippage was a 75 bps subscription revenue headwind from a handful of sovereign cloud deals that closed late. Mastantuono noted that several of those on-premise deals have already closed in Q2. Critically, management did not reduce the full-year guide for further Iran-driven slippage. They held it flat as a buffer. EMEA is 26% of revenue but Iran-related sovereign cloud exposure is a fraction of that. A wider Middle East escalation that meaningfully extended commercial paralysis across the region would be a real headwind to monitor, but the base case is that delayed deals close into Q2 and Q3.
Three Scenarios — Probability-Weighted Outcomes
Each scenario uses FY27 consensus EPS of $5.01 as the earnings anchor and applies a forward P/E multiple calibrated to growth, margin trajectory, and macro environment. Twelve-month holding period from a $86 entry midpoint.
Probability-weight these three scenarios and the expected value lands near $148 against an $86 entry midpoint — roughly 72% expected return. Even the conservative scenario, which requires the SaaS de-rating to persist for another twelve months and ServiceNow to underperform its own raised guide, still generates a positive return because the valuation floor is anchored by a 5.9% FCF yield. That asymmetry is what defines a high-quality entry point in a hated sector.
I want to be honest about what would make me change my view. If renewal rate breaks below 95%, if RPO growth decelerates below 18%, if Now Assist $1M+ customer growth slows from 130% YoY toward sub-50%, or if the FAD long-range plan reveals materially weaker FY27 margin trajectory than the "expansion resumes" language management has signaled, I would step back. None of those signals are flashing today. They are what I would watch for over the next three quarters to validate or invalidate the thesis.
Catalyst Roadmap – What Moves NOW Over 12 Months
This thesis does not depend on a single binary catalyst. It plays out across a sequence of datapoints that compound over twelve months. Each one narrowing the gap between what the stock is pricing and what the business is delivering.
Reading $83 Double-Bottom – Four Charts, One Thesis
Theses get built on fundamentals first. Technicals are a validator. In this case, the chart deck does more than validate. It tells a coherent story about where structural demand sits, where momentum has exhausted, and where the next institutional re-rating is most likely to clear. Below are four views of NOW across different time horizons and indicator families. Read together, they map cleanly onto an $84–$88 accumulation zone with a $76 invalidation.
Long-term structure — monthly view
Monthly chart frames the entire post-IPO trend. From 2017 through January 2025, NOW traced a textbook ascending channel anchored on the 50-month SMA. That trend broke in late 2025 when the SaaS de-rating began, and 2026 has been a step-down through $200, $155, and $115. Critically, current price sits at the $90–$92 cluster that aligns with two pieces of long-term structure: upper edge of the 2021 consolidation range and the rising 200-month SMA. Below that, $77 is the demand zone that capped the worst of the 2022–2023 selloff. Stock would need to break $77 on a monthly close before the long-term uptrend is structurally compromised. That is exactly why $76 is the stop level on this tip. Not a random pick, but the level beneath which an 8-year ascending trend stops being defensible.
Key horizontal levels — daily view with SMA stack
Daily chart with the SMA stack and prior pivot bands gives the clearest read on what the path back looks like. Levels are not arbitrary. Each one is a swing high or swing low that previously absorbed institutional flow, which is why those bands tend to act symmetrically as resistance on the way up. From the $84 "retest" floor: first hurdle is the $100 round-number plus prior consolidation top, second is the 50-day SMA at $104.62, third is the $122 pivot doubling as the 100-day SMA, then $152 which is both the 200-day SMA and lower edge of the late-2024 consolidation. $152 is the level the $145–$155 scenario target zone is anchored to. No part of the path requires NOW to make a new high. It requires NOW to reclaim its own moving averages.
Trend & oversold confirmation — SMA + RSI
This view zooms in on the trend break. Stock is trading well below both the 50-day and 200-day moving averages, an extended condition that rarely persists in large-cap quality names without a mean-reversion bounce. RSI on the daily timeframe entered the oversold zone (under 30) during the April 23rd collapse and is now building positive divergence: price stepping lower while RSI traces a higher low. Same pattern showed up at the 2022 SaaS-correction lows and at the 2020 COVID bottom, both of which preceded multi-quarter rallies. Not a guarantee, but a meaningful signal when paired with the fundamental setup.
Momentum exhaustion — RSI & Vortex multi-year
Secondary panel picks up trend exhaustion that simple RSI sometimes misses. April 2026's reading on this lower indicator is the most extreme on this chart since the 2022 bear market. And 2022 marked the local bottom from which NOW rallied roughly 4x into 2025. Extreme readings on contrarian momentum indicators do not call the bottom, but they identify the zone where risk/reward inverts. That zone is here. Combined with RSI's positive divergence on the daily, the momentum complex is shouting exhaustion, not continuation.
Synthesis — key levels for the trade
Pulling all four charts together. Stock peaked at $238 in early 2025, then traced a sequence of step-downs through $200 to $155 to $115 to the $90s. April 2026 produced two distinct capitulation waves. First wave: a sharp drop into the $80–$84 range on April 10 after Anthropic's Mythos preview triggered cross-sector AI-disruption panic. Stock briefly held the $80 level and bounced into $103 before earnings. Second wave: the 17.7% post-earnings collapse on April 23, retesting that prior $83–$84 low and forming a textbook double-bottom on the daily chart. Volume on April 23rd was the highest single-day print since late 2019. Pre-pandemic capitulation by volume, not just by price. Daily RSI hit deep oversold and is now positively diverging. That is the structural floor the scenario entry zone is anchored against.
Chart pattern alone never guarantees a recovery. Worth saying plainly. But four different views, long-term structure, daily horizontal levels, daily trend and oversold RSI, and multi-year momentum exhaustion, all converge on the same zone. When charts of different time horizons and indicator families agree, that is when technical signals matter. $84–$88 scenario entry zone is precisely where the fundamental thesis and technical exhaustion signal meet. That convergence is what I look for.
Trade scenario – Execution Protocol
Following scenarios reflect the author’s personal analysis and are not investment recommendations. See our full disclaimer.
ServiceNow at the $84–$88 scenario entry zone represents a rare alignment in large-cap enterprise software: lowest forward P/E in company history, double-bottom technical support at $83–$84, beat-and-raise fundamental quarter, $5.5B in projected FY26 free cash flow against a $90B market cap, and a management team that just publicly raised its AI commitment target by 50% mid-quarter. Setup is asymmetric. What it requires from investors is straightforward: size it properly, execute systematically, and stay focused on the 9–12 month window across which the catalysts above get the time to play out. Hard part is not the analysis. Hard part is holding through the noise while the market catches up to the business.
- ENTRY > Build in two tranches. Tranche 1 (60% of intended position) at $84–$88 on confirmation scenario entry zone holds. Tranche 2 (40%) on either additional weakness toward the $78–$80 zone, or on the first close above $100 with rising volume to average in with confirmed momentum.
- SIZE > 3–5% of a diversified equity portfolio is appropriate at this risk classification. Technology-focused investors with conviction may size to the upper end given the strength of the data; macro-cautious investors should anchor at 3%. NOW remains a high-beta growth name with elevated sensitivity to rate expectations and SaaS sector sentiment.
- TP1 > Trim 20–25% of the position at $115–$125. That range represents reclaim of the pre-earnings $103 level plus a meaningful relief rally and reduces cost basis materially. Reasonable level to lock in initial profit if the recovery stalls before the FY27 guide.
- TP2 > Trim a further 35–40% at $145–$155. This is the base-case target midpoint, the Wall Street average price target, and the zone where natural institutional re-rating supply tends to emerge. Locks in the bulk of the base-case gain.
- TP3 > Hold final 30–35% with a trailing stop below the prior monthly low. In the bull scenario (AI consumption flywheel exceeds the $1.5B commit, FY27 guide comes in above $19B subscription revenue), let this portion run toward $185+ as a longer-duration AI Control Tower re-rate.
- STOP > Hard stop on a sustained weekly close below $76. That would indicate either a meaningful fundamental break (renewal rate collapse, major customer loss, AI commit miss in Q2 or Q3), or a broad equity market de-risking severe enough to question all growth valuations. Below $76, thesis no longer holds.
- MONITOR > Quarterly: renewal rate (any move below 95% is yellow flag), RPO and cRPO growth rate (deceleration below 18% is yellow flag), Now Assist $1M+ ACV customer count growth, AI commit run-rate vs. $1.5B FY26 target, FY27 guide when it lands in January 2027. Monthly: NOW vs. IGV relative strength, RSI levels, $100 and $120 resistance reclaim.
Core Thesis - Three Sentences
- ServiceNow is the most defensible AI control tower in enterprise software ($27.7B RPO, 97% renewal, 630 customers at $5M+ ACV, $1.5B in AI commitments already monetized, 50% of net new business already on non-seat pricing), trading at the lowest forward multiple in its history.
- The 17.7% post-earnings drop reflected Armis-driven margin optics and a sector-wide SaaS de-rating triggered by Anthropic's ARR spike, none of which corresponds to fundamental deterioration in NOW's actual operating performance, which beat-and-raised the quarter.
- Even the conservative scenario generates a positive return from $86 entry because the valuation floor is anchored by a 5.9% FCF yield on a 22% top-line grower; the base case to $145–$155 requires only partial multiple recovery toward the FAD long-range plan.
One last thought. This is the part of the thesis that does not fit cleanly into a multiples table. Bill McDermott has been doing this for twenty-five years. He ran SAP. He has been at ServiceNow since 2019. On the call he was unflinching: "Don't fall for the parlor trick that one touch button can replace 22 years of excellence." I do not take CEO quotes as gospel, ever. But when a CEO of that experience publicly raises the AI commit target by 50% mid-quarter, commits explicitly that margin headwinds normalize within twelve months, schedules the Financial Analyst Day to communicate a multi-year plan, and uses the company's worst day in fourteen years to repurchase $2B of stock, that is a coherent set of actions, not posturing. Management is behaving like a team that believes the market is wrong. Looking at the data, I am inclined to agree.
Analyst Note, Bellwether Research Desk, April 30 2026
Important Disclaimer
This content is for informational and educational purposes only and does not constitute financial advice, investment recommendations, or solicitation to buy or sell any securities. Past performance does not guarantee future results. All investments carry risk, including the possible loss of principal. ServiceNow, Inc. (NYSE: NOW) is a high-growth technology company subject to significant risks including: competitive pressure from Microsoft, Oracle, Salesforce, Workday, foundation-model AI labs, and other enterprise software vendors; dependence on continued enterprise adoption of agentic AI and workflow automation; macroeconomic sensitivity as a long-duration growth asset; geopolitical exposure through the Middle East and other international markets; integration risk associated with the recently closed Armis ($7.75B) and Veza ($1.2B) acquisitions; elevated stock-based compensation as a percentage of revenue; potential for further multiple compression if SaaS sector sentiment deteriorates further; and execution risk on the pricing transition from seat-based to consumption-based models. Technical analysis presented reflects historical price and volume data and is not a guarantee of future price movements. RSI and moving average signals are lagging indicators with well-documented limitations. Scenario analysis and price targets are based on publicly available information, independent modelling, and analyst consensus data as of April 2026; actual results may differ materially. Always conduct your own due diligence and consult a qualified financial advisor before making any investment decision. Position sizing guidelines are general in nature and do not account for individual circumstances, tax situations, or risk tolerance.