Every serious energy research report written this year contains the same phrase: the new energy security age. It's not hyperbole. It marks a genuine inflection point - the moment when the old rules of global energy stopped applying and something more complex, more contested, and more consequential took their place.
For most of the post-war era, energy was primarily an economic question. Countries bought what was cheap, sold what they had, and let diplomats handle the politics. That world is gone. Energy is now national security. The cables, pipes, mines, and processing plants that move energy are treated as strategic assets - defended, onshored, or denied to rivals. Beijing's export controls on graphite and gallium. Washington's Inflation Reduction Act. Brussels pledging $750 billion in U.S. energy purchases through 2028. These aren't trade disputes. They're moves on a geopolitical chessboard - and the stakes are higher than at any point since the 1970s oil shocks.
This course teaches you to read that chessboard. Why geography still dictates competitive advantage in energy - and which nations hold the best cards. Why China controls 83-97% of solar manufacturing despite not being the sunniest country on Earth. How OPEC+'s production gambits interact with U.S. shale arithmetic. And what an investment framework looks like when energy volatility is structural rather than cyclical. Energy is no longer just a commodity. It's the currency of geopolitical power.
The Uneven Energy Chessboard
No energy source is universal. Geography still dictates strategic advantage - and disadvantage. Countries have wildly different starting points in natural resources, and the race for energy self-sufficiency is being driven by three things simultaneously: AI's voracious appetite for power, conflict shocks that disrupted existing supply chains, and access to capital. Every nation is now surveying what it has and asking the same question: how do we play this hand?
Solar irradiation isn't distributed evenly. Due to cloud coverage at the equator and reduced annual sunlight near the poles, maximum solar potential concentrates in two narrow latitude bands with minimal cloud cover. Well-optimised solar projects are particularly suited to the American Southwest, central Mexico, Chile, Bolivia, the northern and southern bands of Africa, and Australia. If you're not in those bands, you're fighting physics every step of the way.
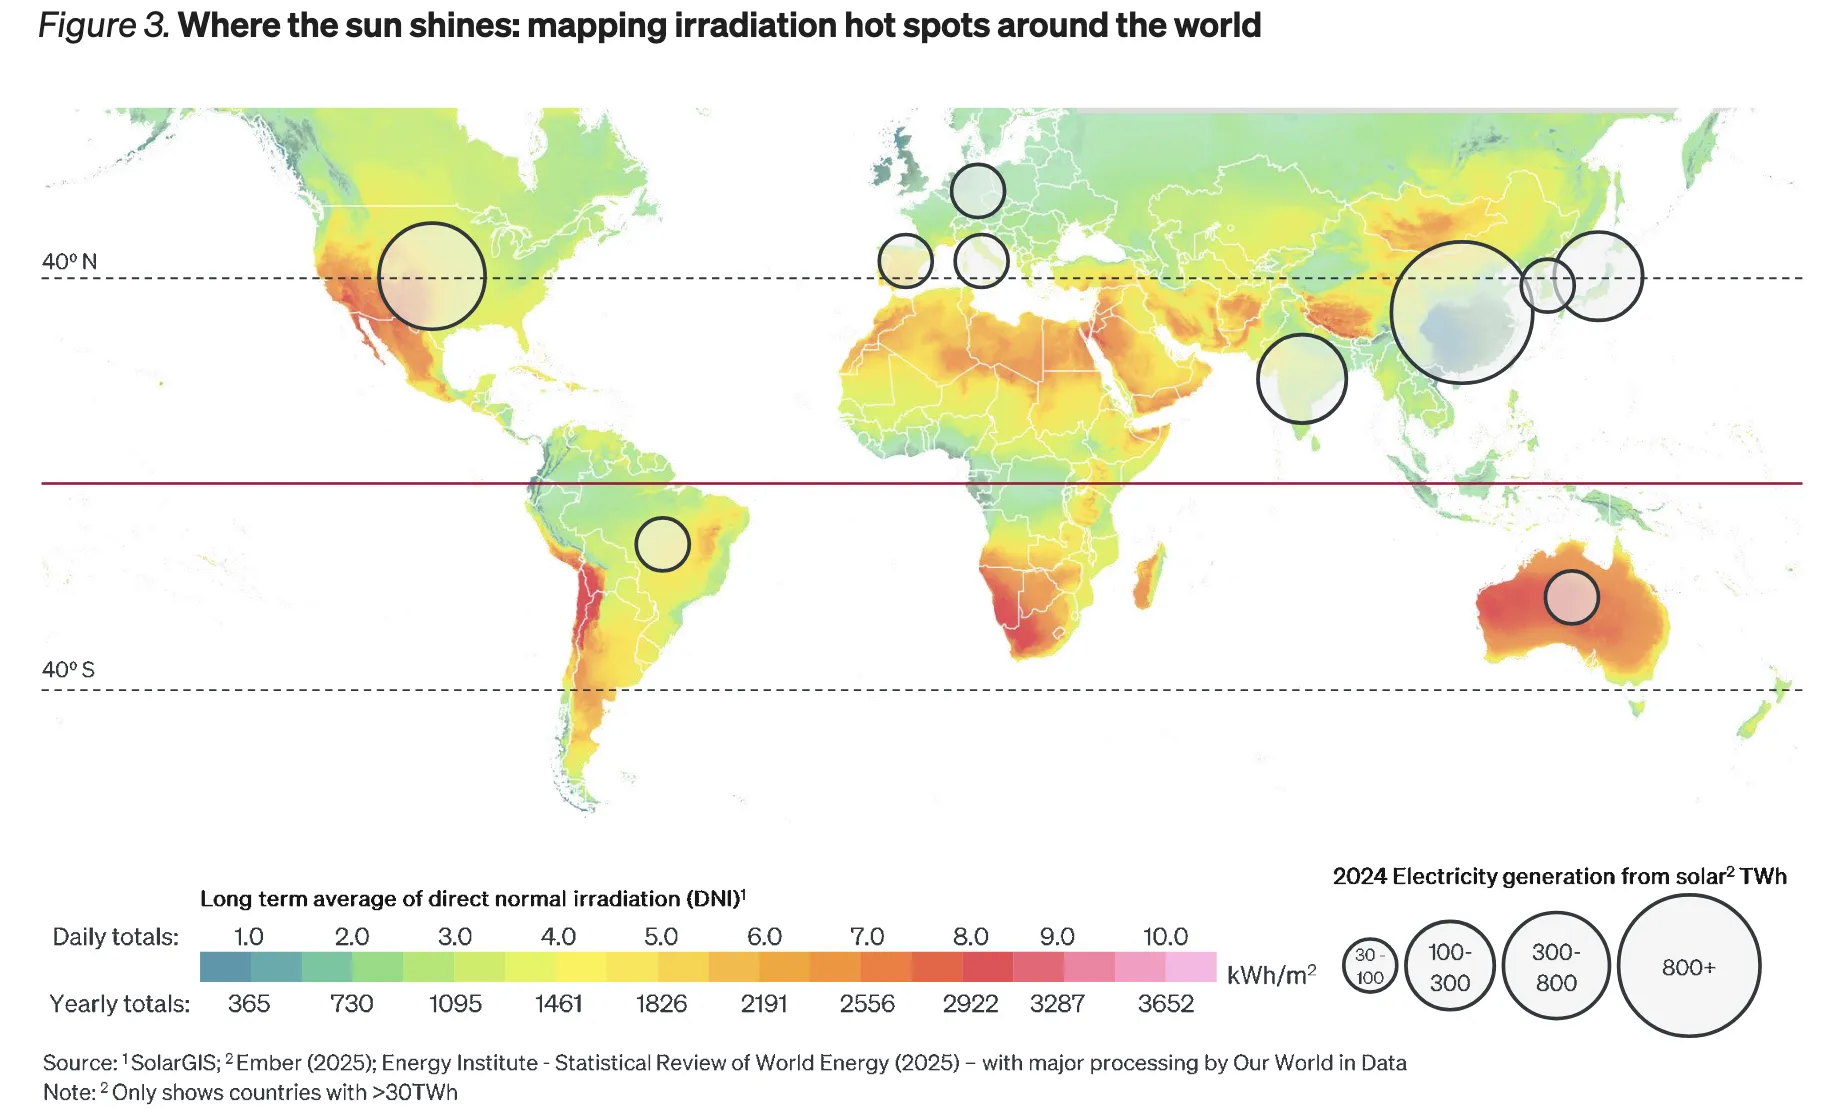
Even petro-states are waking up to their solar geography. In 2025, Saudi Arabia signed $8.3 billion worth of deals for five massive solar farms and two wind farms - approximately 15 gigawatts of new renewable capacity. China and India have drawn enormous solar investment despite not sitting squarely in the top irradiation bands. Proof that policy ambition and manufacturing scale can partially override geographic disadvantage. Partially. The physics still determines the long-run cost floor.
| Energy Source | Geographic Sweet Spot | Key Constraint | Investment Signal |
|---|---|---|---|
| Solar | US Southwest, Chile, N/S Africa, Australia | Intermittency; storage required | FSLR, utility-scale developers |
| Wind (onshore) | Northern Europe, US Great Plains, China coast | Land use; transmission distance | Turbine makers, grid operators |
| Wind (offshore) | North Sea, US Northeast, NE China coast | Ocean depth; cable cost | ENPH, Orsted, grid infrastructure |
| Geothermal | W. USA, Iceland, Indonesia, Kenya; now expanding via deep drilling | Site-specific; exploration risk | Fervo Energy; US/Mexico advantage |
| Fossil Fuels | Middle East, North America, Russia | Transition headwinds; carbon cost | CVX, XOM, SLB for cash yield |
| Critical Minerals | Australia (lithium, cobalt, REE); DRC; Chile | Processing chokepoints (China) | MP Materials, Lynas, Li-Cycle |
Wind, Geothermal & the Drilling Revolution
Wind and geothermal tell a completely different geographic story from solar - and together they shift the map of national advantage in ways that pure solar analysis misses entirely.
Wind strength concentrates at both poles and along coastal waters - almost the mirror image of the solar irradiation map. Countries that lack reliable solar can often compensate with wind. Northern Europe is the clearest example: a consortium of North Sea nations is exploring artificial islands and "wind parks" in the Dogger Bank section to harvest consistently high wind speeds. Shallow coastal shelf waters, where historic oil and gas infrastructure has already de-risked construction, give the North Sea, Southern Australia, and North America structural advantages in offshore wind that newer entrants simply can't replicate cheaply.
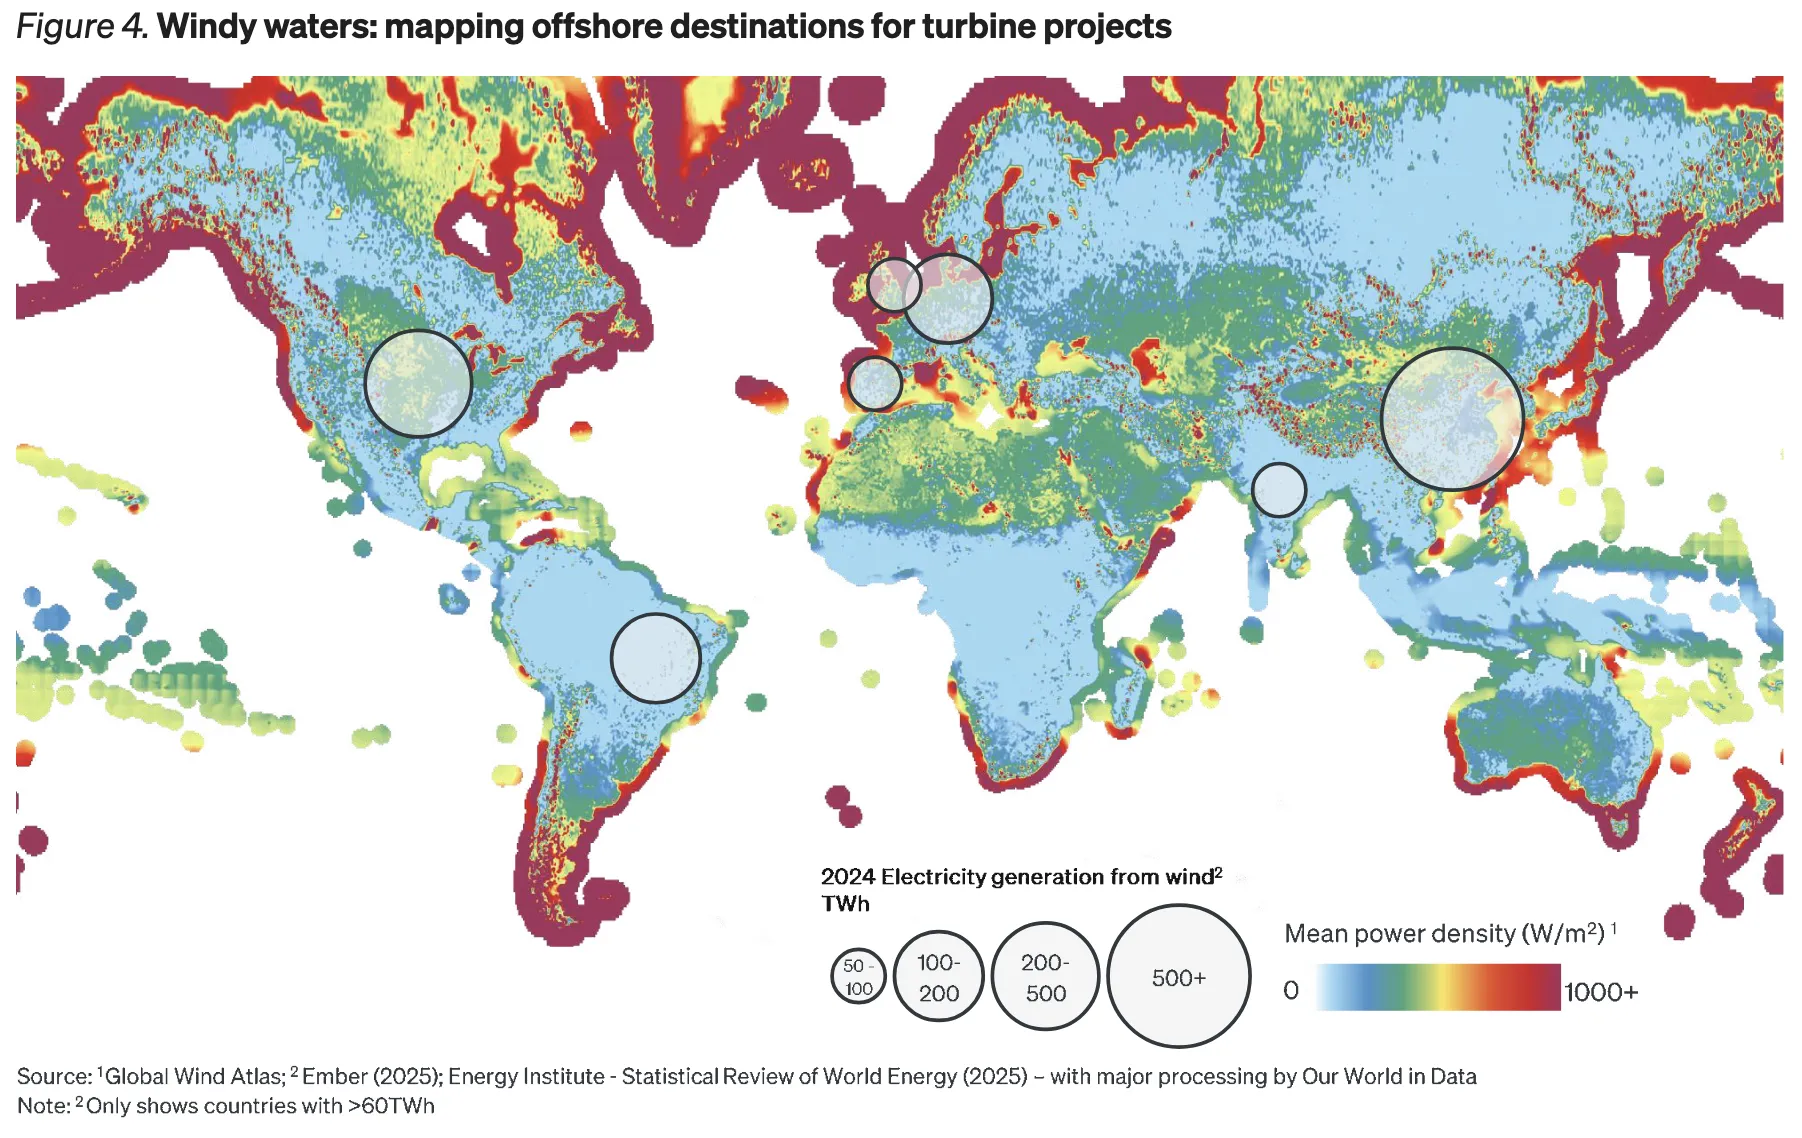
China exploited its wind advantage faster than anyone. In 2024 alone, China added approximately 80 gigawatts of new wind capacity - bringing its total to roughly 520 GW, the most installed wind capacity on earth, accounting for 10% of China's electricity generation. The US ranked second at about 150 GW; Germany third at roughly 73 GW. The gap between first and second is not close.
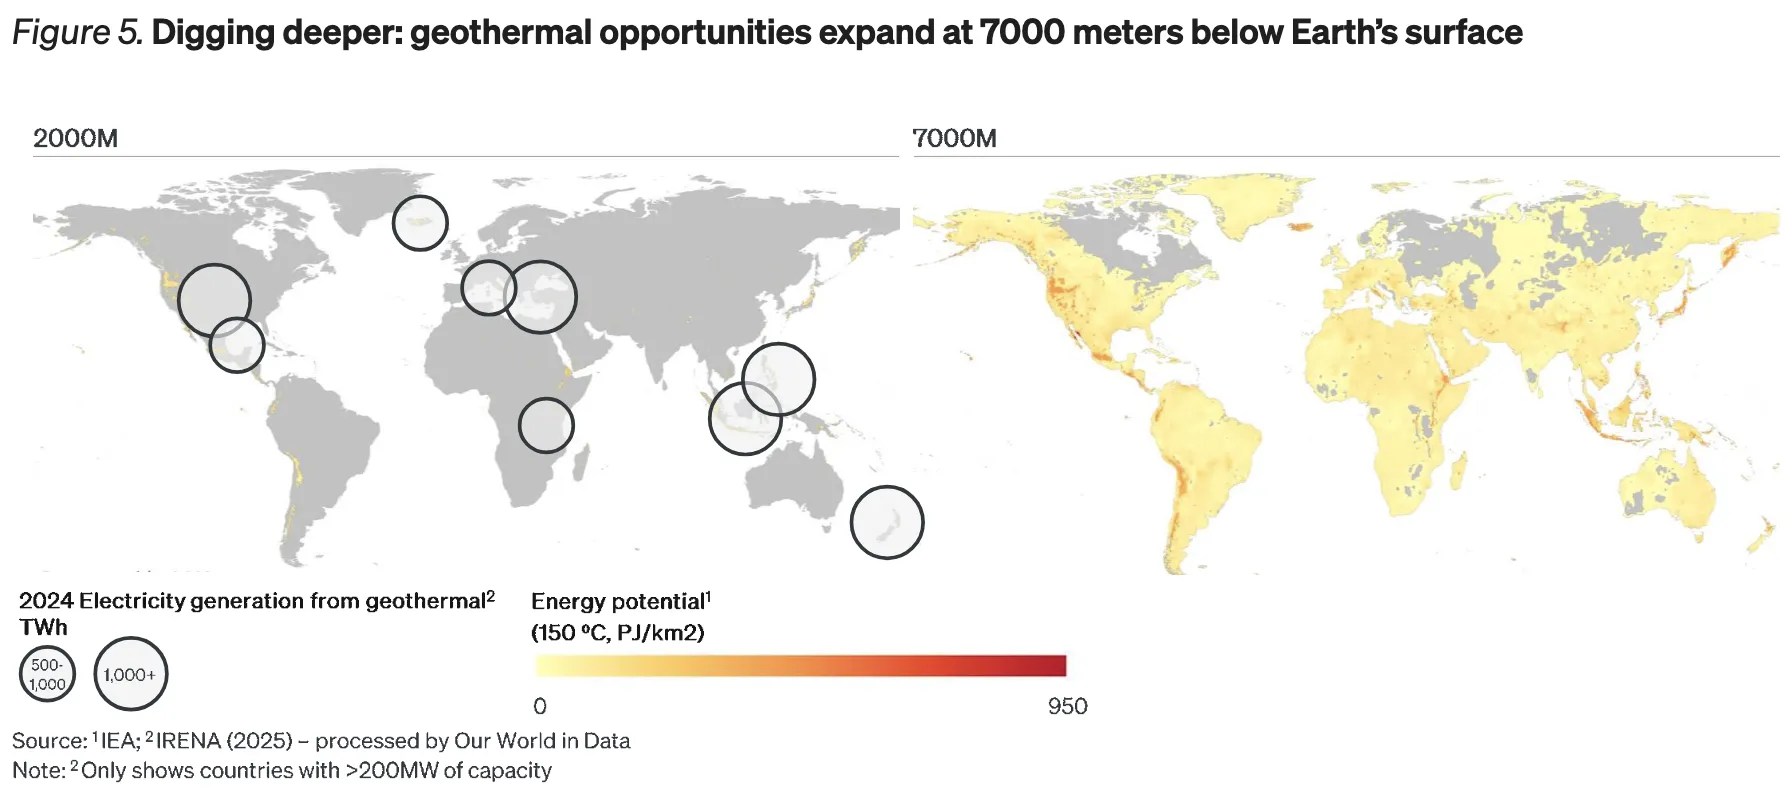
Geothermal is the most underappreciated energy story of 2025. Until recently, viable production was confined to tectonically active regions - the western US, Indonesia, Philippines, Turkey, Kenya, New Zealand, Iceland - where resources sit within 2,000 metres of the surface. Advanced drilling technology is changing that entirely. New horizontal techniques reach 7,000 metres, opening vast new territories to geothermal production. In Utah in 2025, Fervo Energy drilled a well to 15,765 feet in just over two weeks, accessing temperatures of 520°F. The US and Mexico, with their deep oil-and-gas drilling expertise, hold a structural advantage in commercialising this. And unlike solar or wind, geothermal is baseload - it generates 24 hours a day regardless of weather.
Nation Energy Profiles - Who Holds the Best Hand?
Energy advantage isn't simply about what resources you sit on. It's about what you can process, what you can export, what infrastructure you control, and how your alliances shape access. Those four factors separate nations with genuine strategic advantage from those just sitting on raw material they can't fully monetise.
- 13.3M bpd oil (world #1)
- World-leading LNG exports
- Best solar irradiation in SW
- Geothermal technology leader
- Deep shale drilling expertise
- IRA subsidies catalysing clean energy
- 520 GW installed wind (world #1)
- 83–97% of global solar mfg
- Controls critical mineral processing
- Belt & Road energy diplomacy
- Nuclear capacity surpassing US by 2030
- Graphite & gallium export controls
- 49% of global lithium production
- Top cobalt, nickel & REE supplier
- Top LNG exporter
- Excellent solar & wind geography
- AUKUS security alignment
- Building processing capability
- North Sea offshore wind (Dogger Bank)
- French nuclear fleet (60%+ electricity)
- EU Green Deal investment framework
- Cut Russian gas imports by >50%
- LNG import terminals fast-tracked
- Overdependence on Chinese clean inputs
- World's lowest-cost oil producer
- Maximum solar irradiation geography
- $8.3bn 2025 solar & wind deals (15 GW)
- Aims 50% renewable power by 2030
- Pursuing civilian nuclear program
- Aramco pivoting to hydrogen & solar
The nations with the strongest hands have multiple overlapping advantages - not just one. The US holds the broadest: fossil fuels, solar geography, geothermal technology, LNG export infrastructure. Australia has the raw materials but is still building its processing capability - sitting on a gold mine it can't yet fully refine. China has manufacturing dominance but remains import-dependent for oil and faces geographic solar limits. The energy security race will be won by nations that can string together multiple advantages into a resilient system. Single-advantage plays are fragile.
China's Clean-Tech Stranglehold
The most consequential fact in the global energy transition isn't how fast solar and wind are growing - it's that the manufacturing capacity to build them is almost entirely controlled by one country. China's dominance across the clean energy supply chain is not an accident. Two decades of deliberate industrial policy, state financing, and strategic patience got us here. And it will not be undone quickly.
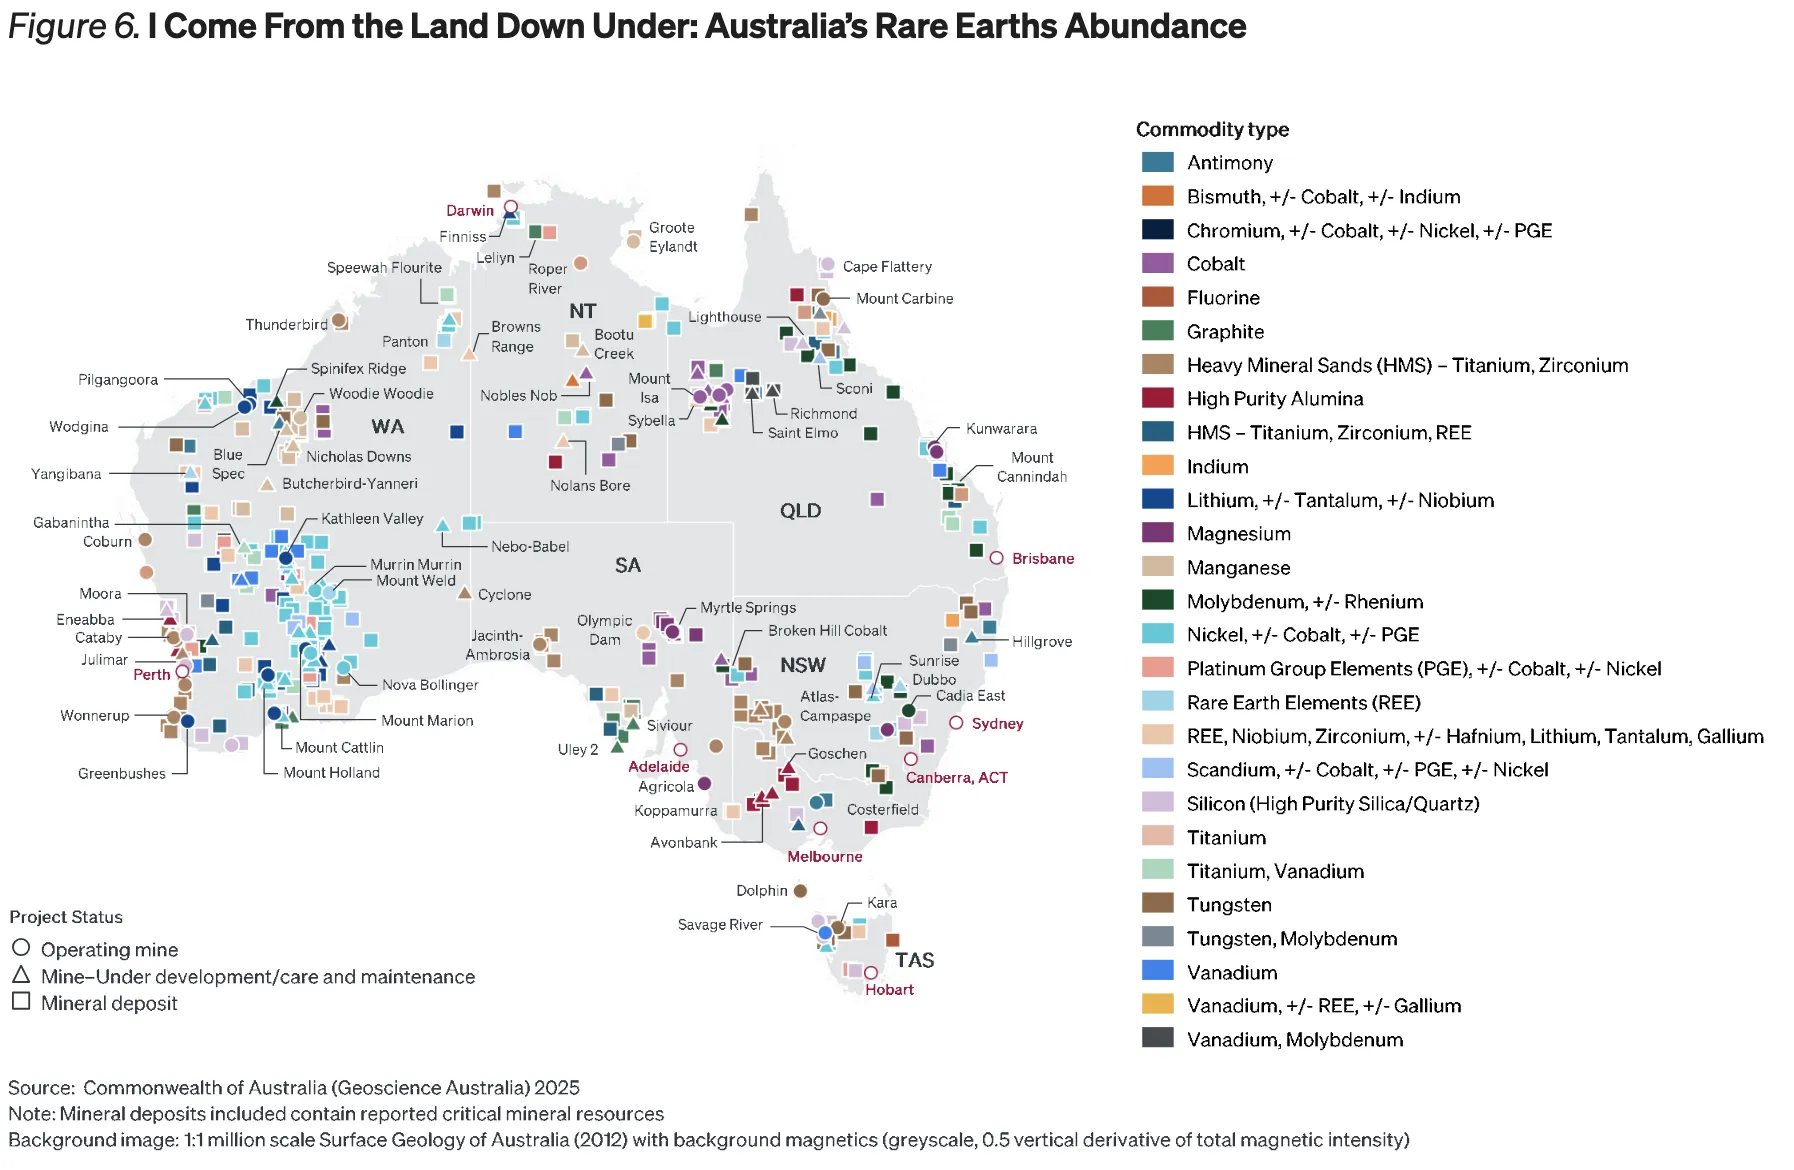
Australia holds some of the world's largest and most diverse reserves of critical minerals - 49% of global lithium production, top positions in cobalt, nickel, and rare earth elements. But here's the catch: Australia exports raw materials, then watches China process them into finished battery components and magnets. The economic and strategic value is captured downstream. Not at the mine. That's the chokepoint that explains China's leverage more clearly than any chart.
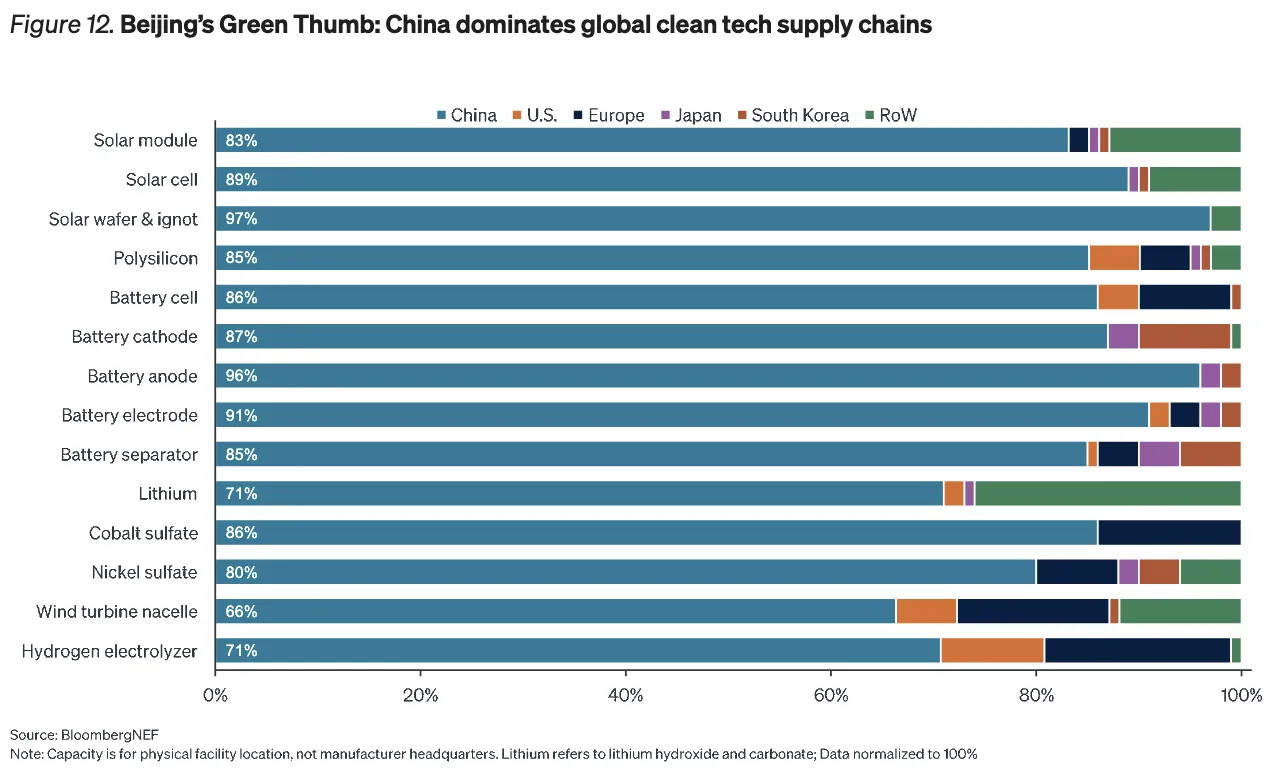
The chart above makes the scale viscerally clear. Across solar modules (83%), solar cells (89%), solar wafers and ingot (97%), battery cells (86%), battery anodes (96%), and battery cathodes (87%) - China's share of global manufacturing capacity isn't just leading. It's structurally controlling. Any country trying to build a clean energy future without a plan for this dependency is building on sand.
China weaponises this position through several levers simultaneously. Export restrictions on graphite and gallium - both critical to batteries and semiconductors - show how midstream processing can be repurposed as coercion on short notice. Belt and Road energy financing to Africa, Southeast Asia, and Latin America is typically tied to Chinese equipment and labour, cementing market share and technological partnership across the developing world. This isn't purely commercial. It's a deliberate strategy to reduce China's own dependence on imported crude while extending its influence over global energy standard-setting. The two goals reinforce each other.
China's Clean-Tech Supply Share
OPEC+ and the Oil Market Gambit
While everyone debates the energy transition, the oil market is undergoing its own structural shift. OPEC+'s September 2025 decision to increase output by 547,000 barrels per day marked a real strategic pivot - from price defence to market share competition. The consequences ripple far beyond the commodity itself.
By accelerating the unwinding of pandemic-era cuts, OPEC+ is deliberately targeting U.S. shale producers, who now dominate global output at 13.3 million barrels per day. The move aligns with Trump's pro-lower-prices agenda, creating an unusual Washington-Riyadh alignment. But it's fragile. Brent below $60 starts biting Gulf state fiscal breakeven levels - and the political calculus changes fast when sovereign budgets are under pressure.
| Metric | Current Level | Key Dynamic | Investment Implication |
|---|---|---|---|
| Brent Crude | ~$70/bbl | OPEC+ hike suppressing price | Hedged energy stocks (CVX, XOM) offer yield with downside protection |
| US Shale Output | 13.3M bpd | World's largest single producer | Flexible swing capacity; watch $55 breakeven threshold |
| OPEC+ Hike | 547K bpd increase | Market share over price defence | Near-term headwind for E&P stocks; long-run supply discipline still holds |
| Potential Surplus | 1.5M bpd (IEA) | If demand falters, oversupply hits | Services companies (SLB) outperform pure-play E&P in volatile oil markets |
| Physical Market | Tight near-term | Inventory drawdown supports prices | Backwardation structure favours spot holders over futures rollover |
OPEC+'s actions ripple into the energy transition in a paradoxical way. Increased oil output delays the urgency of decarbonisation - but the capital generated by oil revenues is increasingly flowing toward renewables. Saudi Aramco is accelerating investments in hydrogen and solar. Russia has deepened its energy ties with China and India following Western sanctions. The oil market isn't simply declining - it's evolving into something more complex, more multipolar, and harder to model than the old cycle playbook accounts for.
For investors, oil market volatility demands a layered approach. Pure-play exploration and production companies carry direct commodity risk - great when oil rises, painful when it doesn't. Oil services companies like Schlumberger (SLB) earn fees regardless of which direction oil moves, as long as drilling activity continues - better risk-adjusted exposure in a volatile price environment. Integrated majors like Chevron and ExxonMobil provide commodity exposure with diversified cash generation and strong dividend cover. The mix matters.
The U.S.-China Clean Energy Trade War
The 135% tariff the United States imposed on Chinese goods has created what J.P. Morgan analysts call a "clean energy paradox." It's designed to protect American industry. But it has simultaneously exposed the gaping gap between U.S. clean energy ambition and U.S. clean energy manufacturing reality. Those two things are not currently close to each other.
Here's the arithmetic: U.S. solar cell production sits at roughly 13 gigawatts as of 2025. Demand requires 50 gigawatts. That 37-gigawatt gap has to be filled from somewhere. With Chinese imports facing punitive tariffs, American utilities have been forced to rely on lithium-iron-phosphate batteries that are almost entirely manufactured in China - even as Beijing's export controls on rare earth elements threaten U.S. magnet production for EVs and wind turbines. The left hand is tariffing what the right hand still depends on.
Meanwhile, the trade war has redirected Chinese export flows toward Europe. The euro area is projected to absorb a 10% surge in Chinese solar panels, batteries, and wind turbines by 2026. Short-term, that boosts European energy affordability - HICP inflation could fall by as much as 0.15 percentage points. Long-run, the risk is overdependence on a single supplier for critical energy infrastructure, especially as Beijing tightens its grip on the underlying minerals. Europe is swapping one dependency for another.
Southeast Asian nations - Vietnam, Indonesia, Malaysia especially - are the beneficiaries nobody talks about. Chinese manufacturers building facilities there to circumvent U.S. tariffs are creating new local industrial bases as a side effect. Battery firms in Southeast Asia and European solar manufacturers are positioned to capture redirected trade flows over the medium term. Not a clean story, but a real one.
The IRA remains the single most important policy lever for U.S. clean energy manufacturing. Its grants, loan guarantees, and tax credits are designed to compress the domestic buildout timeline. But LNG offtake agreements have become part of tariff negotiations - the EU has pledged $750 billion in U.S. energy purchases through 2028, including nuclear technology, LNG, and crude. Energy is trade policy now. Trade policy is energy strategy. The line between them has essentially disappeared.
Hot Zones - Where Energy Meets Conflict
The new energy security age isn't just being shaped in boardrooms and legislative chambers. It's being shaped on battlefields, in shipping lanes, and at chokepoints that carry the blood of the global economy. Four hot zones demand investor attention right now.
The investment lesson from all four zones: energy infrastructure is now a military-grade asset. Physical disruption risk - once priced as a tail event - needs to be front-and-centre in any long-duration energy investment thesis. Companies with geographically diversified production, flexible supply chains, and low-cost operations will weather disruption far better than those with concentrated exposure to a single corridor. That's not a small differentiator. In this environment it's the differentiator.
The Innovation Frontier: LNG, Nuclear, Storage & AI
Even as geopolitical rivalry reshapes energy markets, four technological threads are quietly redefining what's possible - and where the long-run returns will actually come from. Miss these, and your energy thesis is backward-looking.
| Technology | Current State | 2030 Outlook | Key Players |
|---|---|---|---|
| LNG | 2% supply growth in 2024; strong Asia & Europe demand | 6% supply rebound in 2025; "bridge or destination" debate intensifying | US LNG exporters; Cheniere (LNG), Shell, TotalEnergies |
| Nuclear / SMRs | <10% of global electricity; SMRs moving from design to pilot | China to surpass US+Europe nuclear capacity by 2030; SMR commissioning begins | Cameco, NuScale, Rolls-Royce SMR; uranium miners |
| Grid Storage | Global capacity growing; China leads at 43% share | >2 TWh by 2030; 21% annual installation growth; US at 14% share | CATL, LG Energy Solution, battery storage ETFs |
| AI & Data Centres | Data centres driving power demand surge now | AI data centres could drive 10% of global power demand growth by 2030 | Utilities (NextEra, Constellation), nuclear operators, gas turbine makers |
| Clean Energy Investment | $2.1T invested in 2024 (+11% YoY); solar leads | Investment to accelerate as harder-to-abate sectors join transition | FSLR, Enphase, Orsted; clean energy ETFs (ICLN, QCLN) |
LNG's role in the global mix is being actively contested. Critics argue the world shouldn't be locking in another fossil fuel. Advocates argue LNG is not a bridge but a destination - especially as carbon capture advances and nations need stable baseload power to back intermittent renewables. Demand surged in 2024 and 2025, Asia and Europe both scrambling for alternatives to Russian pipeline gas. New export projects are set to drive supply growth toward 6% in 2025. Whether you see LNG as a bridge or a destination depends on your timeline, your carbon targets, and frankly your politics.
Nuclear is staging one of the most important comebacks in energy history, and most investors are still underweighting it. Global investment is rising sharply - especially in China, whose nuclear capacity will surpass the US and Europe combined by 2030. Small modular reactors (SMRs) - roughly a third of the generating capacity of traditional plants, but faster to build, cheaper per project, and more site-flexible - are at the forefront. Unlike conventional plants, SMRs can be turned on and off, making them ideal companions for intermittent renewables. That dispatchability is the quality the grid desperately needs and that most renewables can't provide.
On AI: the 11,000 data centres housing generative AI tools are among the most power-hungry buildings ever constructed. Projected to drive 10% of global power demand growth by 2030 - and hyperscale data centres are set to account for nearly 70% of copper demand in the building sector by that same date. The paradox is real: AI technology promises to cut 5-10% of global greenhouse gas emissions through efficiency gains - but only if the energy powering it is clean. If hyperscalers fall back on new gas plants, the math goes the other direction fast.
Investment Framework: Positioning for the New Energy Age
Energy investing in the new geopolitical era requires a different mental model from the old commodity cycle playbook. You're not just betting on oil prices or solar installations. You're making long-duration bets on which nations, technologies, and supply chains will win in a world where energy is national security. Those bets have different risk profiles than commodity cycles, and they play out over decades, not quarters.
| Pillar | Thesis | Instruments | Conviction |
|---|---|---|---|
| 1. Supply Chain Diversification | Long-term gains go to firms that reduce chokepoints in critical mineral and clean energy supply chains. Lithium recycling and rare earth processing are the most underfunded links. | MP Materials (MP) - US rare earth processing; Li-Cycle (LCX) - lithium recycling; Lynas Rare Earths (LYC.AX) | High (10-yr horizon) |
| 2. Hedge Oil Volatility | Oil is not going away. But volatility is rising. Diversified integrated majors with strong dividends and oil services companies with fee-based revenues offer resilience without pure commodity risk. | Chevron (CVX), ExxonMobil (XOM) for yield; Schlumberger (SLB) for services; XLE ETF for sector exposure | Medium-High |
| 3. Target Geopolitical Winners | Redirected trade flows from U.S.-China tensions create winners. European and Southeast Asian clean energy manufacturers benefit from Chinese exports pivoting away from the U.S. | First Solar (FSLR) - US solar mfg; LG Energy Solution (LGES) - Korean battery; Australian lithium miners | High (policy-driven) |
| 4. AI-Driven Power Demand | Data centres and AI training require enormous, reliable baseload power. Utilities with nuclear, gas, or firm renewable contracts supplying hyperscalers have multi-decade earnings visibility. | NextEra Energy (NEE), Constellation Energy (CEG), Vistra (VST); nuclear ETF (NLR) | High (structural) |
The energy portfolio of the new security age isn't a binary choice between fossil fuels and renewables. It's a barbell. On one side: cash-generating, dividend-paying traditional energy with strong balance sheets. On the other: structural winners in the energy transition - those building the supply chains, storage systems, nuclear capacity, and grid infrastructure a world running on clean electrons will need. Between the two ends of that barbell, geopolitical volatility will create constant trading opportunities. And constant traps for investors who mistake tactical noise for structural signal.
The single most important filter: does this company win in a world where energy is a tool of national security? If yes, the geopolitical tailwinds are enormous. If not - if it's purely exposed to commodity price cycles without differentiated assets or strategic positioning - the next decade will be increasingly difficult. That's not a temporary headwind. It's structural.
Bellwether Research, Research Team, October 2025