This past July, America broke its electricity demand record twice in two days. Nearly 760 gigawatts at peak - enough to power every home in Texas sixty times over. The grid held. Barely. And that record has an expiration date measured in months, not years. The next heat dome that camps over the Midwest, the next wave of AI data centers humming to life in Northern Virginia, or the next semiconductor fab breaking ground in Arizona that needs 500 megawatts before the concrete even cures - any one of those will smash it again.
Everyone's fixated on NVIDIA's forward P/E. The AI chip arms race gets breathless CNBC segments every other day. But the investment story I keep circling back to - the one that actually matters most this decade? It's playing out in the background, barely noticed: the wholesale reconstruction of America's electrical infrastructure. The grid powering every AI data center, every EV charging station, every reshored factory is on average over 40 years old. Built for a world where electricity demand was flat, predictable, and growing at roughly 0% per year. That world ended around 2022. What replaced it is a demand environment nobody in utility planning had modeled. Not even close.
The Edison Electric Institute - representing investor-owned utilities - says the industry sank a record $178 billion into the grid in 2024. Thirteen consecutive years of record spending. And the next five years will need more than $1.1 trillion in total. This is not a cyclical blip or a post-COVID hangover. It is a structural transformation. Frankly, the investment opportunities buried inside it are some of the most durable I've come across in any sector.
The Demand Shock: How Flat Became Vertical
For almost twenty years - roughly 2005 through 2020 - U.S. electricity demand just sat there. Flat. Efficiency gains in appliances and industrial equipment kept total consumption stable even as GDP grew. Utility planners baked that assumption into their capital models like it was gospel. They planned capacity for more of the same. And they were wrong in a way that is going to cost hundreds of billions to fix.
The break came in stages. First the data centers, which seemed manageable - just another industrial load, nothing to rewrite the playbook over. Then the AI acceleration of 2022-2023 changed the math entirely. Here's what caught me off guard about AI training clusters and inference infrastructure: they are extraordinarily power-hungry, sure, but it is the constancy that really bites. An H100 GPU cluster running at capacity draws power continuously, unlike a traditional server farm that load-balances and sleeps. Think of it like a steel mill that never takes a holiday. Data centers consumed roughly 180 terawatt-hours of power in 2024. By decade's end, that number is expected to roughly double. And in Texas and the Mid-Atlantic - where data center clusters are already packed tight - demand is rising 10% or more per year. Not 10% total. Ten percent annually, compounding. That's not a typo.
Now pile on the reshoring of American manufacturing (semiconductor fabs, battery plants, pharmaceutical facilities - each one demanding industrial-scale power), the electrification of transportation, and you get a demand trajectory that no grid built in 1975 was designed to handle. The EIA now forecasts nationwide demand growing at 2-3% annually through 2050, revised sharply upward from 1.6% previously. Wood Mackenzie is blunter about it: power prices across most markets are expected to rise 10-50% above previous forecasts as stronger demand, higher commodity costs, and thermal generation expansion all squeeze supply from different angles at once.
The Virginia Precedent
Northern Virginia hosts the largest concentration of data centers on the planet. Dominion Energy - the dominant utility there - is warning that residential electricity prices in the state could climb an additional 25% by 2030, on top of the 30%+ increase already absorbed since 2020. That is what "AI infrastructure demand" actually looks like at the distribution grid level, where real families pay real bills. And the cost allocation debate - should the price tag fall on data centers or residential ratepayers? - is turning into one of the most politically charged regulatory fights in the utility sector right now. How that shakes out will shape the investment case for utilities operating anywhere near high-density data center markets.
The $178 Billion Year - and Why It Still Isn't Enough
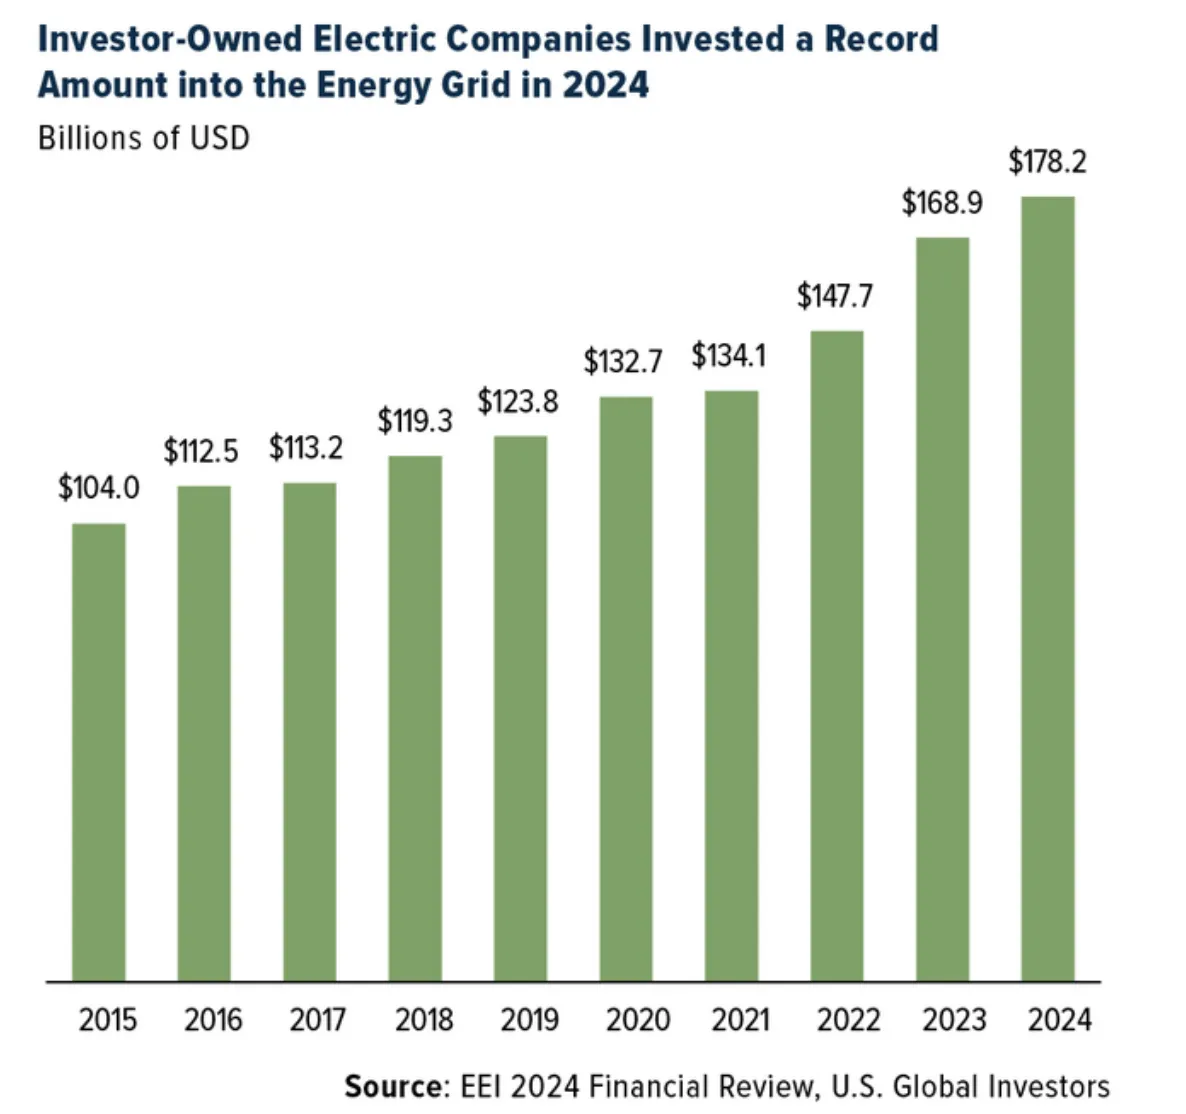
Look at that chart. The compound growth in grid investment over the past decade has been genuinely remarkable - a near-doubling from $104 billion in 2015 to $178.2 billion in 2024. Thirteen consecutive record years. That's not a trend anymore. It is structural reality. But even this pace may not be enough for what is coming down the pike.
Here is the problem, and it's a stubborn one: building new grid capacity is nothing like building a factory. You don't break ground and flip a switch in 18 months. Large power transformers - those massive steel-and-copper beasts that step voltage up and down across regional networks - take 12-18 months to manufacture and another 6-12 months to install and commission. Before the AI surge, lead times were already stretching. Now? Extraordinary. Hitachi Energy recently announced a $457 million transformer manufacturing facility in South Boston, Virginia - set to become the largest domestic producer of large power transformers in the United States - specifically to unclog this bottleneck. But the facility won't begin operations until 2028. Three years out. In a market where demand is rising right now, today, this quarter.
COVID made the whole thing worse. The pandemic wrecked the global transformer supply chain, draining strategic inventories that take years to rebuild. The situation has improved but it is not resolved. When a grid operator in PJM (which manages power for 13 states and DC) anticipates peak demand reaching 154,000 MW - potentially surging to 166,000 MW under extreme heat - and is simultaneously waiting 18 months for replacement components, the operational risk stops being theoretical. It becomes an engineering problem with a political price tag stapled to it.
The Physics of the Grid: Why This Is Hard
I want to spend a moment on why grid modernization is genuinely difficult - not just a matter of writing checks - because most financial analysts glaze over this part. This is not software infrastructure. You cannot add capacity by spinning up a new cloud region. Electricity has to be generated and consumed in near-perfect balance, millisecond by millisecond, across a network spanning thousands of miles and hundreds of generators. The margin for error? Measured in fractions of a hertz.
Storage is the fundamental constraint. Electricity remains extraordinarily expensive to store relative to its value - which is why grid operators pour enormous resources into demand forecasting. Minor mispredictions don't produce error messages. They produce brownouts. Tokyo's grid operator maintains real-time demand forecasts updating minute-by-minute, tracking behavior patterns as predictable as the tide: demand rises as people wake, peaks in late afternoon when residential air conditioning stacks on top of commercial loads, then falls overnight. That gap between the daily minimum (base load) and the peak has shaped power sector economics for over a century. And it's only getting wilder.
Always On
Nuclear, coal, geothermal, hydro - sources that run continuously because their economics and physics demand it. Nuclear is the most capital-efficient of the bunch: rock-bottom marginal fuel costs, but thermal inertia means you can't ramp it quickly. Coal can modulate somewhat but essentially runs or it doesn't. These form the floor under every grid's operations.
Supply Meets Demand
Natural gas, solar, wind - the flexible layer that fills whatever gap exists between base load and what demand happens to be doing at any given hour. Gas ramps in minutes; solar and wind follow the sun and atmosphere. Battery storage is rapidly muscling into this layer too, with CAISO (California's grid) already running 11 GW of battery capacity that shifts solar generation into evening peak hours. That number was basically zero five years ago.
Expensive Insurance
Gas turbines - essentially jet engines bolted to generators - that sit idle most of the year, justified economically only by keeping the lights on during annual peak demand windows. Worst economics of any generator: high fuel cost, miserable utilization. But the market needs them because demand peaks are real and they don't care about your spreadsheet. The economic equivalents are virtual power plants: software and contracts that achieve the same load-shedding without the steel.
So why does any of this matter for investors? Because the composition of the generation mix is changing faster than at any point in grid history. Battery storage costs have fallen 85% over the past decade. Solar is now the cheapest source of new electricity generation - not just cheaper than coal, cheaper than any fossil fuel alternative, with or without subsidies. That single fact is permanently rewiring the economics of every layer of the generation stack.
The Renewable Reality vs. the Political Fight
I've been tracking the gap between renewable energy rhetoric and renewable energy reality for a while now, and it keeps widening. President Trump has described offshore wind as "STUPID AND UGLY WINDMILLS" and blamed high electricity prices on green energy projects. Makes for memorable Truth Social content. Does not survive contact with the data.
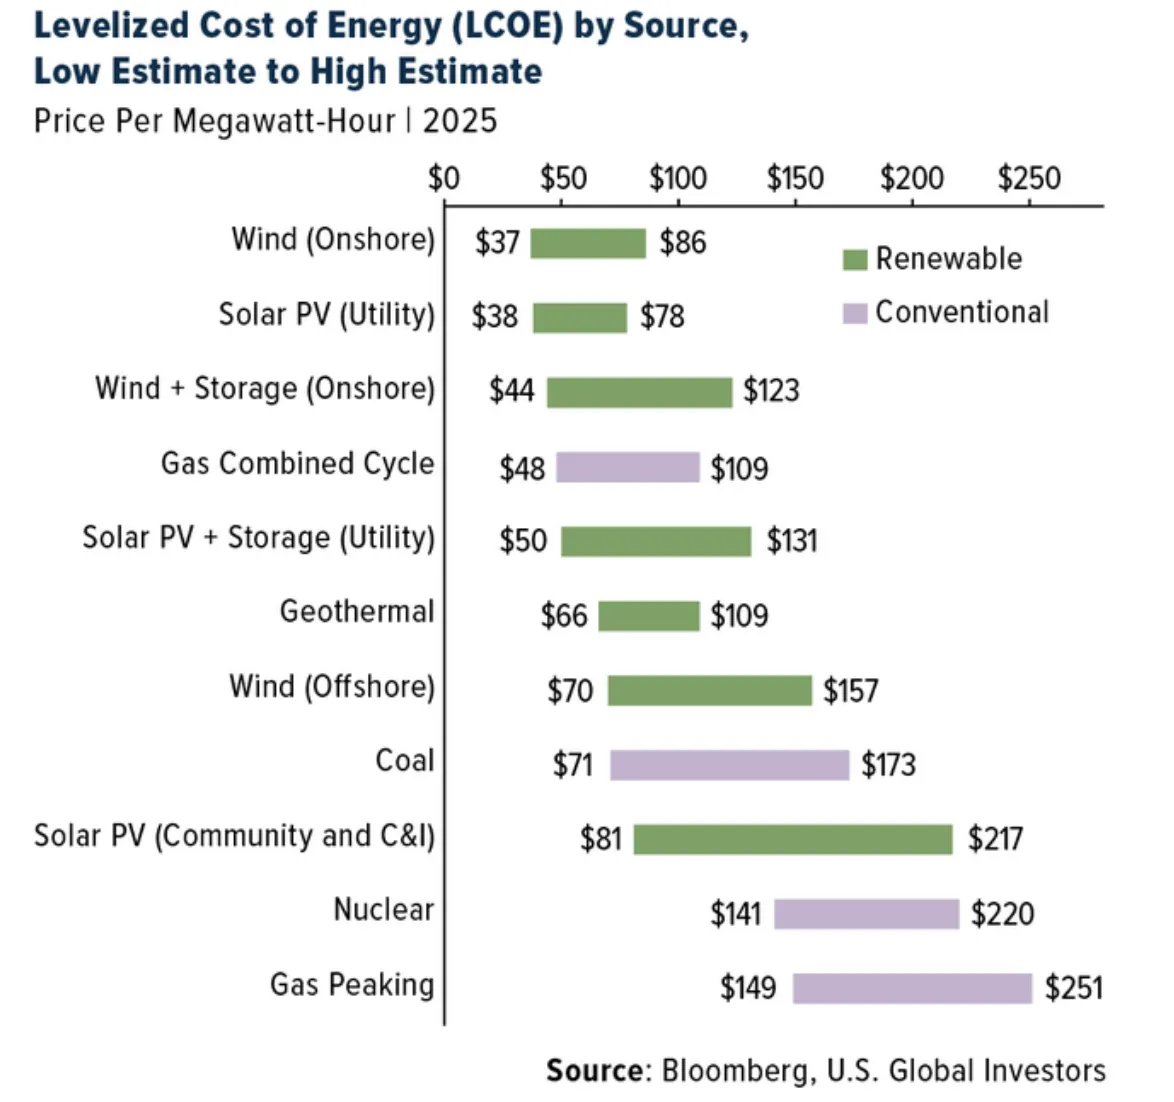
Take New Jersey - the state specifically cited in those posts. Offshore wind projects there never got built. Wind contributes less than 1% of the state's electricity. So what is actually driving higher bills? Rising natural gas prices (up nearly 14% year-over-year as of summer 2025), the cost of upgrading infrastructure that should have been replaced a decade ago, and surging industrial demand from data centers. The LCOE chart above tells the story without requiring any political decoder ring: utility-scale solar delivers power at $38-78 per megawatt-hour. A new gas peaker - the thing the political narrative implicitly defends - costs $149-251 per megawatt-hour. Three to six times more expensive. Private equity and institutional capital understand this perfectly well, which is why BloombergNEF reports the majority of new energy investments globally are flowing into renewables, not fossil fuels. The money doesn't lie.
But renewables don't solve everything. That needs saying too.
They require transmission buildout, storage, and backup - real infrastructure investments with their own timelines and costs that nobody should hand-wave away. Wind development faces genuine regulatory headwinds under the current administration, with additions projected 17% lower by 2050 than previous forecasts. The cancellation of the $4.9 billion Grain Belt Express loan guarantee - an 800-mile transmission line that would have piped wind power from Kansas to population centers in the east - drew bipartisan criticism precisely because it removes infrastructure that would have improved grid reliability, not just expanded wind capacity. Real setbacks. Real costs.
The long-run economics, though, are not in doubt. By 2050, Wood Mackenzie projects clean energy will constitute 72% of US electricity generation. The Electric Power Research Institute projects that household energy spending will fall by more than a third in real terms by 2050 - as gasoline spending (currently around $3,000 per household annually) shifts to electricity, and electricity itself gets cheaper as renewables muscle into the generation mix. The pain is front-loaded. The payoff is structural. Patient capital knows the difference.
The National Security Layer
There is a dimension of the grid story that rarely gets adequate play in financial analysis, and honestly it is the piece that worries me more than the demand forecasts: supply chain vulnerability. The United States currently relies entirely on imported capacitor film - a critical component of power grid stability hardware - with zero domestic manufacturing capability. Zero. Large power transformers, the backbone of long-distance transmission, are manufactured almost exclusively in Asia and Europe, with lead times exceeding two years for specialized units. The Department of Energy has warned explicitly that America lacks the supply chain for true energy independence.
The Supply Chain Chokepoint
In early 2025, Ontario threatened a 25% surcharge on electricity exports to several U.S. states in retaliation for tariffs - a move ultimately suspended. But the episode laid bare how fast energy interdependence can become a geopolitical pressure point. The deeper concern is structural: imported grid hardware potentially gives foreign manufacturers - and potentially foreign governments - visibility into critical infrastructure configurations. The Forbes Communications Council framed it plainly: the grid is America's biggest national security vulnerability that the public isn't talking about. China's capacity to disrupt America's supply of grid materials grows with every year of manufacturing dependence.
This is exactly why Hitachi Energy's $1 billion U.S. investment announcement - part of a $9 billion global strategy - carries significance well beyond the corporate press release. The Virginia transformer factory is specifically designed to bring onshore a critical supply chain that currently has no domestic equivalent at scale. CEO Andreas Schierenbeck's framing was precise: "Bringing production of large power transformers to the U.S. is critical to building a strong domestic supply chain for the U.S. economy and reducing production bottlenecks." That's a company making a multi-decade bet on U.S. energy infrastructure spending. Not a quarterly earnings play. A generational one.
Texas Senate Bill 6 tells a similar story from the policy side. It gives ERCOT the authority to require large power users - data centers, crypto mines, industrial plants pulling 75 MW or more - to switch to backup power or shut down during grid emergencies. When a single data center cluster can stress an entire regional grid, who gets access to power and when stops being just a regulatory question. It becomes strategic.
The Investment Framework: Who Benefits
The grid modernization story maps onto a broad investment opportunity set, but the quality of opportunity varies a lot by sub-sector. The most interesting positions, in my view, are not the obvious ones - and I have spent the last six months digging into names that benefit from the plumbing of this transition, not the headlines.
| Category | Key Names | Investment Logic | Key Risk |
|---|---|---|---|
| Large Utilities (Regulated) | NEE ($153B), VST, DUK, SO | Regulated returns on massive capex, 94% raised dividends in 2024, AI demand directly boosts rate base growth | Rate case outcomes, political pressure on cost recovery, rising interest rates |
| Grid Equipment & Transformers | Hitachi Energy (6501.T), ABB (ABBNY), Eaton (ETN) | Structural supply shortage; transformer lead times 18+ months; domestic buildout required; direct capex beneficiaries | Execution on new capacity; competition from Asian manufacturers at lower cost |
| Energy Storage | NEE (indirect), Enphase (ENPH), Bloom Energy (BE) | CAISO already at 11 GW battery storage; Asia Pacific storage revenues to grow from $14B to $184B by 2035; every renewable deployment drives storage demand | Policy reversals on storage incentives; technology competition; ENPH margin pressure from competition |
| Battery Materials | Albemarle (ALB), Panasonic (PCRHY), BYD (BYDDY) | Structural demand from grid storage, EVs, and backup power; domestic supply chain imperative creates policy tailwind | Lithium commodity cycle volatility; ALB notably weak YTD due to soft lithium prices despite strong long-term demand |
| Independent Power Producers | Vistra (VST), Talen Energy, Constellation (CEG) | Merchant power pricing rises 10-50% per Wood Mackenzie; nuclear assets command AI-driven contracted power premiums (Microsoft, Google) | Merchant price volatility; nuclear regulatory complexity; capex requirements for life extensions |
| Broad ETF | Utilities Select SPDR (XLU), iShares Global Clean Energy (ICLN) | Diversification across the full utility value chain; lower maintenance than stock-picking | Sector-level valuation risk; interest rate sensitivity for regulated utilities |
NextEra Energy - The Standard Bearer
NextEra Energy (NEE) at $153 billion market cap is the largest publicly traded utility in the world, and I think it is the clearest expression of where this whole sector is heading. It's the world's largest wind and solar power generator, operates Florida Power & Light (one of the most reliable utilities in the country), and has a development pipeline positioned to benefit from every major demand driver at once: data centers, EV charging, manufacturing reshoring. The stock's historical performance has been outstanding for a "boring" utility - and 94% of utilities raised dividends in 2024, with payout ratios higher than any other US sector. In a world of rising power demand and rising capex budgets, regulated utilities with strong rate bases are not boring. They are compounding machines with regulatory moats around them. The kind of thing you own and forget about for ten years.
The Global Picture: Asia Leads, Europe Struggles
The U.S. grid story doesn't exist in a vacuum, and what's happening overseas sharpens the investment case quite a bit. Wood Mackenzie's 2025 global power market outlook has the numbers: Asia Pacific is experiencing an investment boom of historic proportions, with generation investments projected at $3.9 trillion over the next decade - 44% higher than the previous ten years. Energy storage in particular is going from niche curiosity to mainstream infrastructure. Storage revenues in Asia Pacific alone are projected to jump from $14 billion in 2024 to $184 billion by 2035. A thirteenfold increase. The region drove 82% of worldwide power demand growth between 2015 and 2024, and that structural weight is not going anywhere.
Europe's picture is messier. Political commitment to decarbonisation remains strong on paper, but permitting and grid connection bottlenecks keep gumming up actual deployment. Offshore wind faces rising cost pressures. Demand growth is weakening as traditional industrial sectors wrestle with macro headwinds. The energy transition is happening in Europe, just slower and more expensively than the original plans called for. For anyone allocating global energy infrastructure capital, the return opportunity is currently weighted toward Asia Pacific and the U.S. Europe is the laggard.
Chile offers a strange and interesting edge case. A 16% renewable energy oversupply is projected by 2035 as solar buildout outpaces demand growth. Marginal power costs there will fall 64% from $53/MWh to $19/MWh by 2040. Think about what that means for copper mining operations in the Atacama - which will consume 46 TWh of power by 2050 - cheap renewable energy fundamentally rewrites their cost structure. This is one of the cleaner indirect plays on the grid buildout story: copper miners and lithium producers in Chile whose energy costs decline structurally even as global power prices climb everywhere else. Like finding a discount aisle in a store where everything else is getting marked up.
The Three Risks Worth Taking Seriously
Grid Instability Events
PJM is anticipating peak demand hitting 154,000-166,000 MW under extreme scenarios. Remember the Texas winter storm of 2021? That showed how quickly a stressed grid can fail catastrophically. As AI data centers pile large, continuous loads onto systems designed for residential fluctuation patterns, the probability of regional stress events - brownouts, rolling curtailments, emergency demand response - just keeps climbing. Texas SB6's curtailment authority is a policy response to a real engineering risk, and the risk is only getting worse.
Policy Reversal on Renewables
The Trump administration's cancellation of the Grain Belt Express loan and hostility to offshore wind have real economic consequences - not just political theater. Wind project additions are already projected 17% lower by 2050 versus prior forecasts. If the regulatory environment for renewable interconnection worsens further, utilities face higher all-in costs for meeting demand - costs that ultimately flow to ratepayers and compress margins. Policy risk here isn't symmetric though: it can slow the transition but probably cannot reverse the underlying economics. The math does not care about politics.
Interest Rate Sensitivity
Regulated utilities are effectively long-duration bonds with equity upside. A $1.1 trillion capex program financed at 6% interest rates looks very different from one financed at 4%. Rising rates compress utility valuations and make dividend yields less competitive against fixed income. The rate environment of 2022-2023 did real damage to utility stocks. Any investor in regulated utilities needs a view on where rates are going over a 5-year horizon. No way around it.
"The grid is the foundation that the AI revolution is built on - and it is the most underpriced risk in the AI investment narrative. Investors pricing in the revenue growth of hyperscalers and chip designers are implicitly betting that the physical infrastructure powering their servers will scale on schedule. It will not scale on schedule without $1.1 trillion in capital investment, transformer factories that won't open until 2028, and regulatory frameworks that are only now beginning to acknowledge the problem. The constraint is real. The investment opportunity on the right side of that constraint - utilities, grid equipment, energy storage - is also real, and it is considerably cheaper than the AI stocks that depend on it."
Conclusion: Follow the Electrons
Here's a number worth sitting with. The EPRI's long-run projection says that by 2050, American household energy spending could fall by more than a third in real terms. The mechanism is counterintuitive but it holds up: as transportation electrifies, the $3,000 per household spent annually on gasoline shifts to electricity bills, and as renewables take over the generation mix, the marginal cost of electricity itself declines. So yes, electricity bills are up 5.5% in the past 12 months, and climbing further in high-demand markets like Virginia. Short-run pain. But the long-run trajectory bends the other way.
For investors, the framework I keep returning to is dead simple. Electricity demand in the United States is rising at the fastest pace in decades, driven by forces - AI, manufacturing reshoring, electrification - that are not cyclical. They are not going away. The grid serving that demand is old, underpowered, and dependent on imported components in ways that are increasingly recognized as a national security concern. And the companies building its replacement - utilities executing record capex programs, equipment manufacturers onshoring transformer production, storage firms making battery economics work at grid scale - they're collecting revenues and dividends that compound quietly while the financial press debates which chip stock will hit $200 first. Frankly, that's fine by me. Let the crowd chase the shiny thing. The electrons lead.
Key Takeaways
America's grid investment will exceed $1.1 trillion over the next five years - driven by AI data center demand, manufacturing reshoring, and electrification of transport. The grid has not been built for this; modernization is not optional, it is existential for every industry that depends on reliable power.
Renewables are the cheapest new generation source at $0.04/kWh for utility solar, against $0.15-0.25/kWh for gas peakers. The economics are not political; they are a procurement reality that private capital has already internalized, regardless of what policy cycles do at the margins.
The most underappreciated positions are grid equipment manufacturers and regulated utilities with strong rate base growth. NextEra Energy is the sector's clearest expression of the long thesis. Hitachi Energy's transformer factory bet on domestic supply chain rebuilding is a decade-long structural play. Battery storage revenues in Asia Pacific alone will grow from $14 billion to $184 billion by 2035. The electrons lead. Follow them.
Research Desk, Bellwether Research, September 5, 2025