Situation Report
On July 14th, PJM Interconnection published a document that should have moved more markets than it did. Capacity auction reports are dull by design. This one is not.
PJM runs the electricity market for 67 million Americans across thirteen states, and its 2028/2029 auction cleared at $325 per megawatt-day, which is the administrative price ceiling, for the third auction running. Two numbers underneath that headline matter more. Brand-new generation and uprates contributed 524.7 megawatts to a market clearing about 138,000. And PJM ran its own simulation of what the auction would have produced with no cap and no floor: $554.72, worth an extra $13.3 billion to sellers.
So here is my position, stated before the evidence. Electricity scarcity in the AI build-out is real, measured, and physical. Scarcity and profit are different things. Markets have spent two years conflating them. Where a bottleneck creates durable excess return depends almost entirely on how often you get to reprice. Every layer of this stack signed a contract of a different length. That single variable, not proximity to the shortage, decides who gets paid.
What follows maps the physical constraint honestly, then runs each layer of the stack through the only test that matters: can it earn above its cost of capital after power costs, financing costs and political intervention? Some can. Most cannot. And a few are being paid today for a scarcity that has an expiry date printed on it.
Auction That Could Not Clear
Starting with what a capacity auction actually does, because the mechanism carries the argument. PJM pays generators to exist three years ahead of delivery, on the theory that a grid needs standby iron it may never dispatch. Sellers offer, a demand curve sets the quantity, and a single price clears for everyone. For a decade that price told you almost nothing, hovering between $28 and $165 per megawatt-day, because supply was abundant while demand sat flat.
Then it moved. Delivery year 2024/25 cleared at $28.92. Delivery year 2025/26 cleared at $269.92. Nothing in the physical world changed by a factor of nine in twelve months...what changed was that data centre load arrived faster than PJM's planning assumptions and the demand curve walked up a very steep supply stack. Since then, three consecutive auctions have hit the ceiling regulators installed to contain the damage.
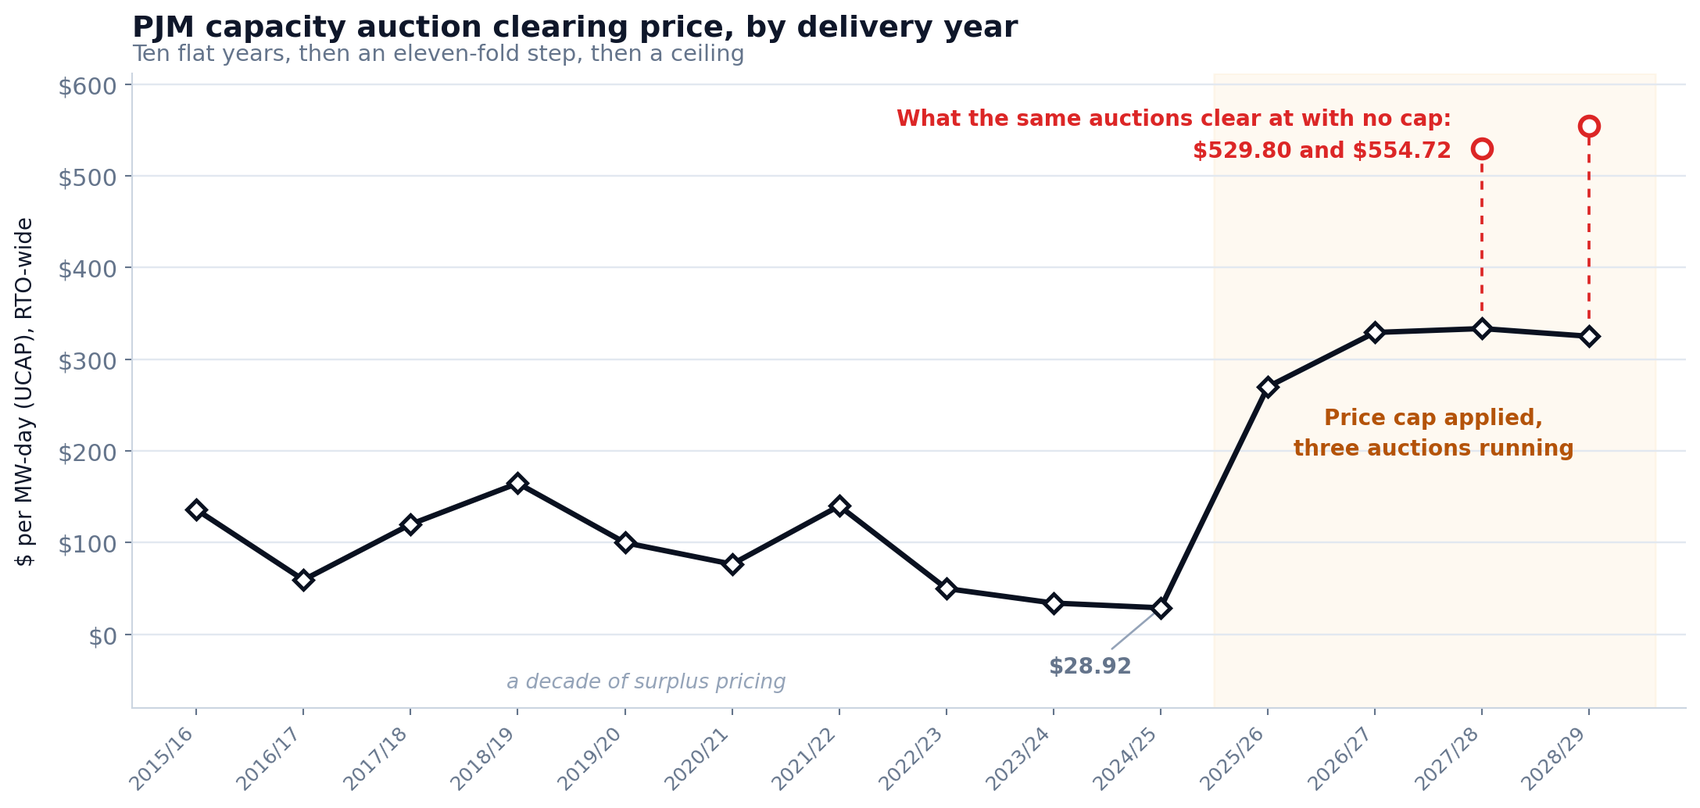
Let's look at what the 2028/29 auction actually procured, this is where a comfortable story falls apart. Cleared volume rose 3,733 megawatts against the prior auction, which sounds like supply responding to price. Almost none of it was new. New generation and generation uprates totalled 524.7 megawatts. Almost all of it came from re-rating existing plants upward and from fewer megawatts sitting unoffered. In a market that had just repriced ninefold and then held near its ceiling for three years, developers delivered roughly half a gigawatt of genuinely new steel.
That is your first read on whether high prices fix this. They have not, yet. Reluctance is not the reason. It is duration. Asim Haque, a senior vice president at PJM, put the physics plainly at a conference this year. No forecast in this study is more important than his sentence.
"You can build a data center in two years. The power plant to fuel it takes seven."
Asim Haque, Senior Vice President, PJM InterconnectionTwo years against seven. Every dislocation in this study descends from that gap. Haque's arithmetic elsewhere sharpens it: PJM is a system of some 180,000 megawatts heading past 220,000 within a decade, and data centres account for 94% of that projected peak-load growth. ERCOT tells the same story on a different grid, projecting summer peak demand near 145 GW by 2031 against 85 GW in 2024, over half of that increment from data centres and crypto miners. And PJM cleared the 2028/29 auction at a 14.4% installed reserve margin against a 20% target, five and a half points short, for the second consecutive auction below requirement. A capacity market whose entire purpose is procuring reliability failed to procure it, twice, at its maximum permitted price.
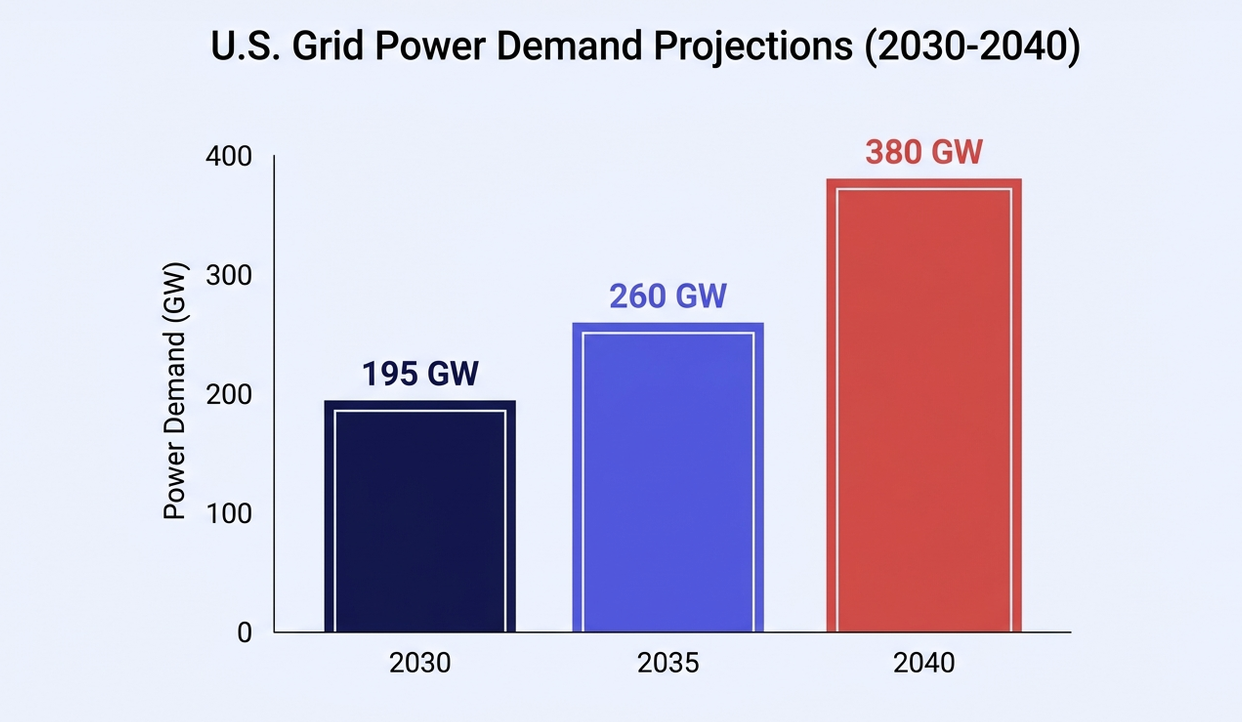
Zooming out from one grid operator and the same shape appears nationally. JPMorgan's private bank published the cleanest version of it in July, drawing on NERC's long-term reliability assessment.
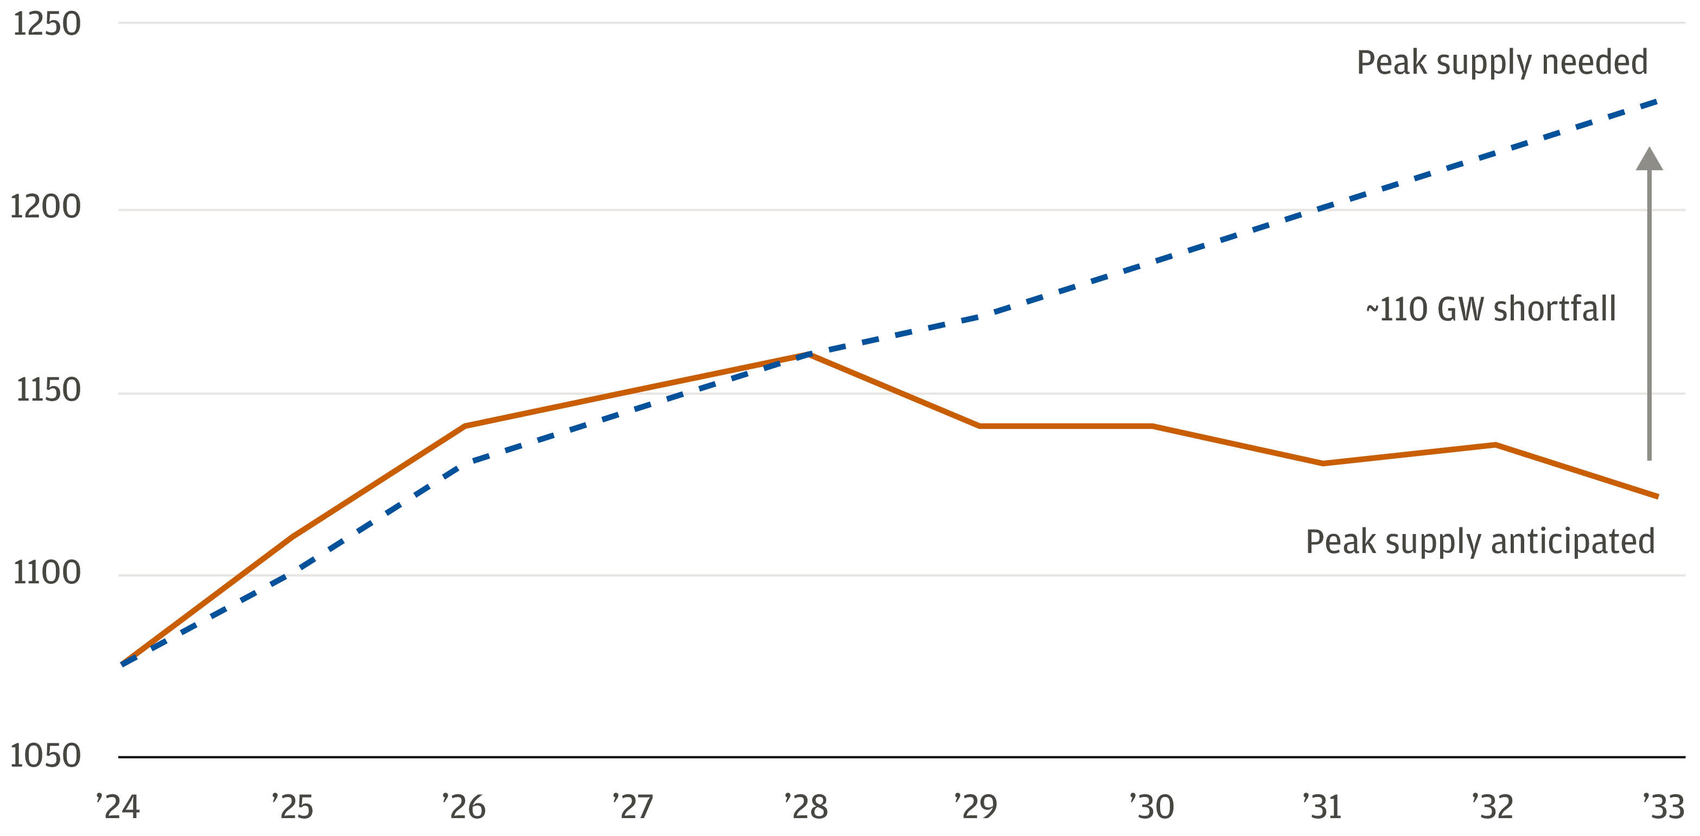
That chart's main point is easy to miss, worth dwelling on. If the shortfall were purely an AI demand shock, it would be self-correcting: build enough generation and the problem ends. Because a significant share of it is coal and gas retirements landing on the same decade, the gap persists even in scenarios where AI demand disappoints. JPMorgan puts cumulative underinvestment in US power at some $3 trillion since 1999. American power has been running its asset base down for a quarter century. AI has arrived at exactly the wrong moment to notice.
How big is the AI piece specifically? BlackRock's technology team puts data centres at some 42 GW in 2025, needing another 148 GW of additions by the end of the decade, against total US demand growth of 175 GW over the same span. Their chart makes that distribution obvious. It is also the reason a household in Ohio now has a stake in a training run.
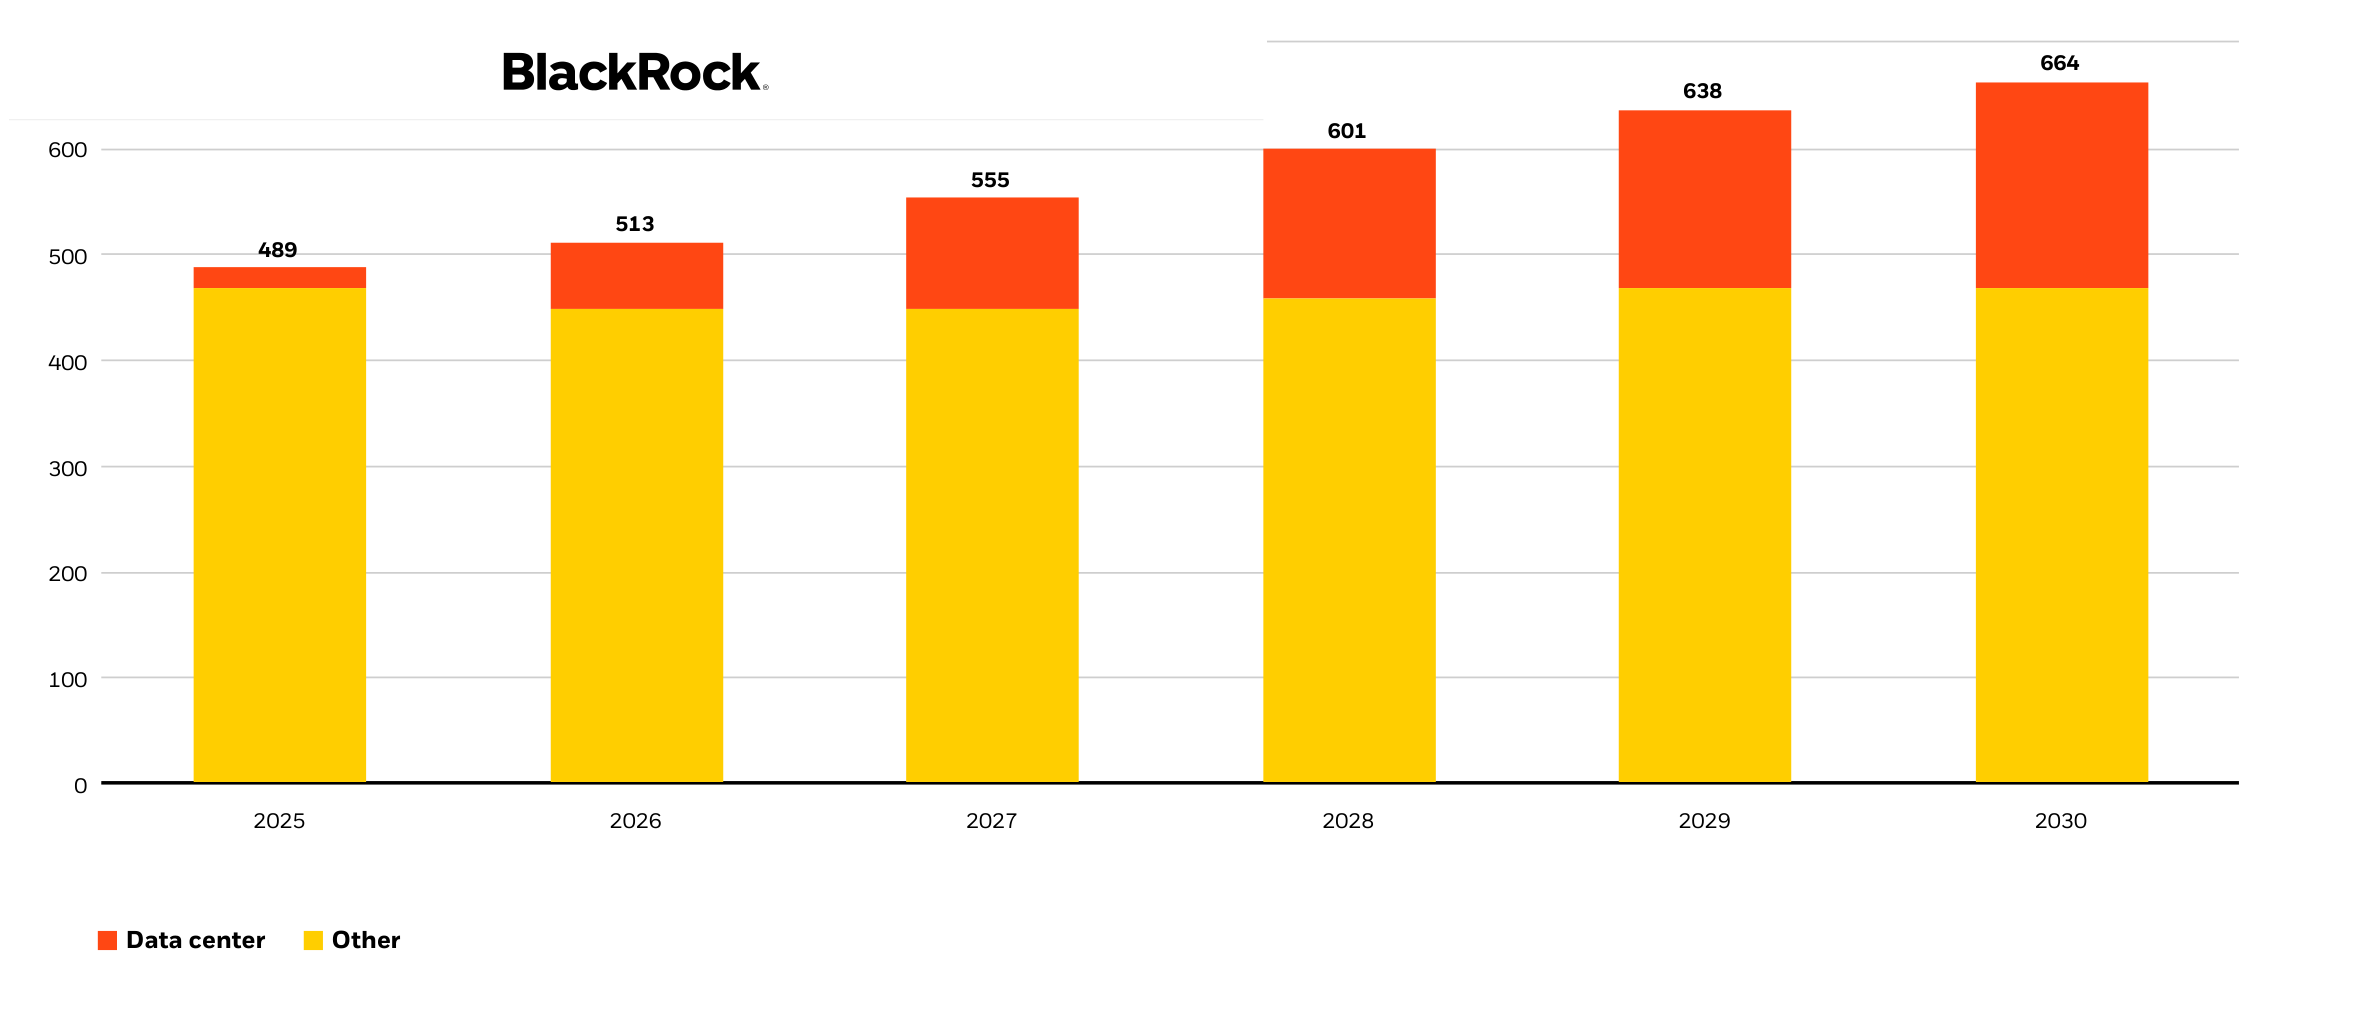
That last sentence is the whole political economy of this study in one line. Chapter V collects the bill. First, the physical anatomy, because investors keep buying "power" as though it were one thing.
Five Layers, Five Clocks
Electricity reaching a GPU passes through five distinct businesses with almost nothing in common except a customer. Generation makes electrons. Transmission and distribution move them, stepping voltage down through substations to transformers. Equipment manufacturers build that hardware. Data centre developers convert delivered power into conditioned, cooled, redundant power at the rack. Financiers fund all of it. Grouping these under one "AI power" heading is roughly as useful as grouping tankers and refineries under "oil."
What separates them is not margin or growth. It is the clock.
Turbines, transformers, switchgear, cooling. Each order is a fresh negotiation at current scarcity. Customer takes delivery, owns the asset, and carries the residual-value risk. Supplier keeps the pricing power and none of the obsolescence.
Merchant generators sell into auctions and spot markets that clear yearly or faster. Purest exposure to scarcity pricing, therefore purest exposure to whatever ceiling a regulator installs above it.
Twelve to eighteen months per proceeding, ending in an allowed return on a larger asset base. Growth arrives; excess return does not, because a capped return is the entire regulatory bargain.
Energised land with an interconnection position, leased long. Today's scarcity price gets fixed for a generation. Wonderful if scarcity persists. No second bite if it does not.
Long leases funding short-lived silicon. Rent obligation outlives three GPU generations. Here the bottleneck is a liability wearing an asset's clothes.
Hold that framework and the sector stops looking like a single trade. Now the physical detail, because two constraints inside it are genuinely under-appreciated.
Queue, and why capital cannot jump it
Any large new load or new generator must first clear an interconnection study run by the regional grid operator: a sequence of engineering reviews that restarts every time a project ahead of you withdraws. Wait times ran two to three years between 2000 and 2015. By 2024 they had stretched toward five, and Lawrence Berkeley National Laboratory found half of all requests now withdraw before reaching commercial operation. In Northern Virginia, the densest data centre market on earth, the queue runs seven years.
That produces a counterintuitive consequence, one that explains most hyperscaler behaviour since 2024. Capital is not the binding constraint. More than 2,600 gigawatts of generation and storage sat in US interconnection queues as of late 2024, which is 2.4 times total installed US generating capacity. Electricity is not missing. Permission and wires are missing. Neither responds to a higher bid.
Iron, and why it cannot be scheduled
Second constraint is physical hardware. Here the bottleneck becomes genuinely inelastic. Large power transformers, the bespoke units that step transmission voltage down to something a data centre can use, quote two to five years. Switchgear runs up to three. Most large units are built in South Korea, Germany and Japan, with domestic US capacity covering a fraction of domestic demand. Duties on copper, aluminium and steel currently sit at 25% after being halved from 50%.
Now set that against how much wire America actually builds. Across 2020 to 2025, the United States added roughly 400 new high-voltage line-miles per year. For context, the DOE's draft 2026 National Transmission Needs Study reports 85,000 circuit-miles energised, upgraded or rebuilt across the nine years to 2024. Congestion still added an estimated $11 billion to wholesale electricity costs in 2023, with most of it occurring in just 5% of operating hours. Nothing about this shortage is uniform. It is acute in specific places, for a few hundred hours a year. Those hours are where the money changes hands.
Demand pressure inside the building has moved just as violently. This chart is the reason equipment content per megawatt keeps climbing.
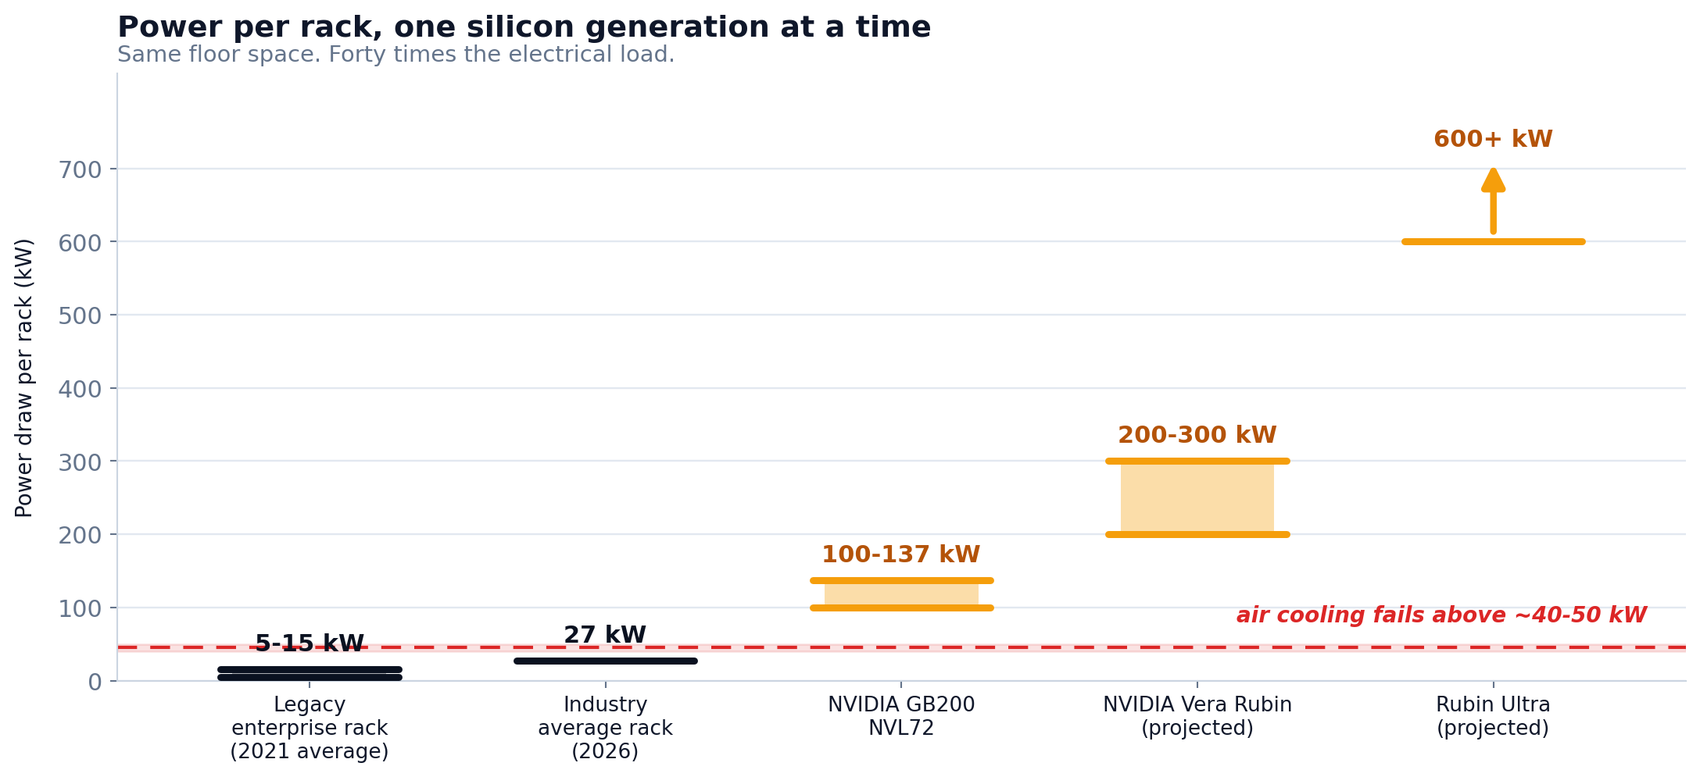
Average industry rack density moved from 7 kW in 2021 to 27 kW in 2026, while frontier systems moved far further and faster. Cost follows: AI-optimised sites spend about $4.6m per megawatt on cooling against $2.4m at conventional sites, and $3.6m on in-building electrical work against $2.2m. Electrical content sold per megawatt is approaching double traditional levels, which is a quiet but powerful margin tailwind for anyone selling into the box rather than around it. Vertiv's own roadmap states the commercial logic bluntly, an "increase in content opportunity per MW."
Which brings us to the question the whole study exists to answer.
Who Captures Scarcity Rent
Rising demand does not produce good returns. It produces revenue. Revenue is what tempts investors into capital-intensive industries that then spend three decades failing to earn their cost of capital. Airlines had demand. Shipping had demand. US shale had spectacular demand. Ask their shareholders how the compounding went.
So run each layer through five questions. Does it own something physically scarce? How often can it reprice? Who eats the residual-value risk when scarcity ends? How much capital does a dollar of revenue consume? And who is legally entitled to take the rent away?
Those five collapse into one arithmetic test worth writing out, because most sector commentary skips it entirely. A business earns excess return only when the spread it charges, multiplied by how often it can reset that spread, exceeds what it costs to carry the capital sunk underneath. Three ways to fail that test: charge a good spread but never get to reset it, reset constantly but sink so much capital that the carry eats the spread, or have somebody else set the spread for you. Every layer below fails or passes on exactly one of those.
| Layer | What it owns | Repricing | Residual risk | Rent exposed to | Verdict |
|---|---|---|---|---|---|
| Electrical equipment & cooling | Manufacturing slots, engineering IP, installed-base service annuity | Every order | Customer | Competitor capacity additions | Captures it |
| Engineering & construction | Skilled crews, permitting know-how, scheduling | Every contract | Shared | Labour cost inflation, component delays | Captures it |
| Powered-shell landlords | Energised land, interconnection position, substation | Once, then locked 10–25 yrs | Landlord, at lease end | Tenant and guarantor credit | Front-loads it |
| Independent power producers | Dispatchable and nuclear fleets in constrained zones | Annual auction, spot | Owner | Price caps, state intervention | Rents it back |
| Regulated utilities | Franchise monopoly, expanding rate base | Rate case, 12–18 months | Ratepayer, via prudence review | Commissions, legislatures, voters | Grows, cannot excess-earn |
| Compute landlords | GPU fleets and contracts, on rented floors | 2–5 yr revenue vs 10–15 yr rent | Tenant | Silicon obsolescence, one customer | Pre-commits it away |
| Hyperscalers | Demand, distribution, and the end-user relationship | Continuous, on their own products | Owner | Whether AI monetises | Pays now, options later |
Equipment layer, where evidence is unambiguous
Every other layer in this study is an argument. Equipment is arithmetic, so look at it first.
GE Vernova ended the second quarter with a 116 gigawatt gas turbine backlog, expecting reservations sold out through 2030 by the close of this year, leaving roughly 10 GW of availability across 2029 and 2030 combined. Manufacturing output is scaling toward 30 GW a year by 2030. Against a US market needing somewhere between 100 and 150 GW of additions this decade, the position is obvious: a supplier who cannot physically satisfy demand for five years does not negotiate on price.
Vertiv shows the same dynamic further down the wire. Its numbers are the cleanest proof in the sector. Second-quarter sales up 24%, adjusted operating margin up 410 basis points to 22.6%, free cash flow of $925m against $277m a year earlier, and full-year guidance near $14.0bn, up 37%, with margin up 340 basis points, net leverage at minus 0.1 times, meaning more cash than debt. Eaton runs the same pattern, with Americas data-centre orders reported up 240%. Quanta Services carries a backlog near $48.5bn.
Growing 37% while expanding margins 340 basis points, on net cash, is the signature of pricing power, not volume. A company merely riding demand grows revenue, then gives the margin back to input costs. These businesses are keeping it.
And note who owns the turbine, the transformer and the chiller after installation. Not the manufacturer. When a data centre is obsolete in 2034, the residual-value problem belongs to whoever holds the building. By then the equipment maker has banked the cash and moved to the next order.
Which is why the equipment layer answers this study's central question first: it sits inside the bottleneck, reprices continuously, and exports its obsolescence risk to the customer. Nowhere else in the stack does all three hold at once.
Now the objection to my own answer, because it is a good one. Fast repricing cuts both ways. A business that renegotiates every order captures scarcity going up and surrenders it coming down, with no contracted floor underneath. Peak multiple on peak margin on peak backlog is a well-documented way to lose money in industrials. My preferred layer is arguably the highest-beta expression of the very capex risk this study warns about. I hold the position anyway, for a reason Chapter VII sets out: equipment is the only layer that still ships in the scenarios where I am wrong. Least-bad across four futures is a weaker claim than best in one. It is also the claim the evidence supports.
Generation, where scarcity is real and rent is not yours
Merchant generators look like the obvious trade. Capacity prices went up eleven-fold, they own the capacity, arithmetic follows. Except it does not, as PJM has now demonstrated three times.
Regulators installed a cap precisely because the rent became large and visible. Running the same auction with no cap or floor, PJM's own appendix puts the difference at $13.3 billion of gross revenue that sellers would have received and did not. That money did not vanish into inefficiency. It was transferred, deliberately, from generators to load, by administrative decision, in a market where the reliability requirement was not met. Scarcity was maximal, the physical case for high prices was strongest, yet the rent was still capped.
Fairly stated, that cap is a temporary settlement rather than a permanent rule. PJM is separately reforming its queue and its large-load rules. Someone holding merchant generation can reasonably argue the ceiling lifts once market design catches up. My objection is not to the specific measure. It is that a rent large enough to be worth $13.3 billion in a single auction, arriving in a year when households are already angry about their bills, will attract an instrument of some kind whether or not this particular one survives.
Morgan Stanley's team reached the same conclusion from the other direction. Their view is that power spreads widen about 15%, creating some $350 billion of value across the supply chain, while simultaneously flagging that "merchant power companies whose margins are driven by power prices may face challenges given greater policy efforts to reduce customer energy bills." Both halves are true. They land on different companies.
Nuclear-heavy independent producers occupy a better seat than most, because a bilateral contract with a hyperscaler for round-the-clock carbon-free output sidesteps the auction entirely. Roughly 30 GW of nuclear power purchase agreements have been announced since 2024, while the four largest hyperscalers now account for 87% of all US corporate clean energy procurement, having quintupled contracted capacity since 2022. That is genuine, contracted, long-duration demand. It is also, by construction, a fixed price signed today against a fifteen-year horizon, which is the landlord's trade rather than the merchant's.
Regulated utilities, and a bargain that has not changed
Here I want to be careful, because a lot of otherwise sensible analysis has gone wrong on this point.
Rate base expansion is real and enormous. Estimates of required US grid investment run from $600bn of transmission and distribution spending through 2030 up to $1.3 trillion by the same date depending on scope, against a sector that has under-invested for twenty-five years. Utility earnings growth expectations have accelerated into the high single to low double digits. Regulated utilities are likely to deliver roughly 70% of the sector's earnings growth over the next two years, so this is not merely an independent-producer story.
None of that is excess return. A regulated utility earns an allowed return on equity, set by a commission, on prudently incurred capital. Bigger base, same percentage. Growth without re-rating potential is a perfectly respectable investment proposition. It is categorically different from capturing a bottleneck. Anyone modelling utilities as scarcity beneficiaries has confused the size of the asset with the return on it.
Worse, the regulated layer is where political risk concentrates, because it is the only layer that sends a bill to a voter. Chapter V takes that up.
Powered-shell landlords, paid once for a decade of scarcity
Now the layer almost nobody outside the industry can name, whose economics are also the most widely misread.
A powered-shell landlord owns the thing that is genuinely scarce: land with an energised interconnection, a substation, and a queue position somebody else would wait seven years to earn. Many of them are converted bitcoin miners who bought cheap power in the crypto era and woke up holding the deed to the constraint. They do not sell electricity and they do not run compute. They rent out the right to plug in.
Economics look spectacular. For a while they are. One representative West Texas conversion signed a 10.5-year triple-net lease at $65 per kilowatt per month on gross power, escalating 3% a year after year five, on a site where electricity runs around $0.05 per kilowatt-hour. Triple-net means the tenant carries taxes, insurance, maintenance and the entire data centre fit-out. Rent lands close to pure yield on the power position.
Now apply the test. Capital intensity is high but largely already sunk. Spread is wide. Repricing happens once. That single fact governs everything else. Whatever scarcity premium existed on the day of signature is the premium for the next decade, adjusted only by an escalator that has no relationship to what a megawatt is worth in 2034. If scarcity persists, this layer left money on the table. If it evaporates, this layer is the only one that already banked it.
Residual risk is where it turns uncomfortable. At lease end the landlord owns a purpose-built AI hall and must find a second tenant for a building configured around silicon three generations obsolete. Whether that has value in 2036 depends on assumptions nobody is underwriting today, with the landlord as the party who finds out. Verdict: real excess return, front-loaded, fixed, and not compounding. A bond with a building attached.
Compute landlords, where clocks run backwards
Then the layer that breaks the framework, in the most instructive way available.
Neoclouds, the specialist providers who own GPU fleets and sell dedicated AI capacity on multi-year contracts, occupy the position everyone assumed would be the most valuable one in this stack. Closest to the customer. Holding the scarcest asset. Sitting in the fastest-growing part of the market. Category revenue runs about $12bn a quarter, a $48bn annualised rate, with the six largest collectively valued above $150bn. CoreWeave alone carries a revenue backlog near $99.4bn across 49 data centres it overwhelmingly does not own, against 2026 capital expenditure guided to $30–35bn.
Run the same test and the picture inverts completely. They lease floors for ten to fifteen years. They fill those floors with silicon that commands premium pricing for two to five. A ten-and-a-half-year lease spans three GPU generations, so the tenant must refinance and refill the same hall three times over, at whatever price prevails on each occasion, before the rent obligation expires. Rent escalates 3% annually throughout. GPU rental rates carry no such guarantee, while the competition on the third refill includes depreciated hardware from the first.
Concentration compounds it. Roughly two-thirds of CoreWeave's prior-year revenue came from a single customer. Five of the six largest neoclouds share that same anchor tenant. A layer whose largest single risk factor is one company's capital-allocation committee is not capturing a bottleneck. It is intermediating one, on borrowed floors, with borrowed credit. Verdict: negative-skewed, the only layer here where the bottleneck arrives as a liability rather than an asset.
Second clock, and what it actually reveals
Line those five verdicts up. Something sharper appears than the framework I set out in Chapter II.
I said the variable was how often you get to reprice. That is only half of it. What decides the outcome is whether your revenue reprices faster than your costs do. Every layer runs two clocks, not one, with the money living in the gap between them.
Equipment sells at spot on every single order while its own input costs sit under contract and hedge. Revenue clock fast, cost clock slow. That gap is precisely the 340 basis points of margin expansion Vertiv guided to.
Compute landlords have the identical mechanism running in reverse. Costs are fixed for fifteen years, escalating on a published schedule; revenue resets every two to five years into a market where last generation's hardware competes against them on price. Cost clock slow and rising, revenue clock fast and falling. Same gap, opposite sign.
Powered-shell landlords have no gap at all, because both clocks stopped on the day of signature. Utilities and merchant generators face a third condition entirely, which is that the clock belongs to somebody else.
You earn excess return when your revenue reprices faster than your costs.
You lose it when your costs reprice faster than your revenue.
And you never get it at all when a regulator sets your price.
Nothing in those three lines is specific to electricity, which is the point. Chapter IX returns to it.
Who Pays, and With Whose Balance Sheet
Someone is funding all of this. Until recently the answer was straightforward: operating cash flow at four of the most profitable companies in history. That answer changed on July 23rd.
Alphabet reported second-quarter free cash flow of minus $5.85 billion, the first negative quarter since its 2004 listing, with capital expenditure of $44.9bn against $39.1bn of operating cash flow. Long-term debt rose 111% to $98bn across six months. Contractual commitments now exceed $800bn. Trailing twelve-month free cash flow remains comfortably positive near $53bn, with about $240bn of cash and securities still on the balance sheet, so this is not distress. It is a threshold. A company that printed cash for two decades has crossed into funding its growth externally. It did so in the same quarter its peers raised guidance.
Combined 2026 capital expenditure across Amazon, Microsoft, Alphabet and Meta now runs near $725 billion, up 77% from about $410bn in 2025. Third consecutive year of growth above 60%. Morgan Stanley's expectation is that the mega-caps fund about half from their own cash flows and the other half from credit markets. Credit markets have obliged: hyperscaler bond issuance reached $225bn by mid-2026 on Fortune's tally, running toward a $400bn annual pace, with Amazon alone printing near $54bn in a single March transaction.
Then there is the part that does not appear on a balance sheet at all. Moody's estimates off-balance-sheet liabilities across the group at near $1.2 trillion, of which about $820bn relates to data centres under construction, held through long-term GPU purchase commitments, leases and special-purpose vehicles funded by private credit. Meta's Louisiana campus sits inside one such structure with Blue Owl. Disclosure lives in the footnotes rather than the liabilities line.
Ray Spitzley, vice chairman at Morgan Stanley, framed the dependency without dressing it up.
"We're simply not going to get all of this capacity built, whether it is data centers or grid infrastructure, without strong credits."
Ray Spitzley, Vice Chairman and Co-Head of Energy Transition Investment Banking, Morgan StanleyHe is right. And the sentence contains the risk. Credit is being lent down the stack rather than earned at each rung. Chipmakers and hyperscalers now guarantee the lease obligations of companies below them so that landlords can borrow against a promise the tenant could never make alone. NVIDIA guaranteed some $860m of one neocloud's rent as part of a warrant purchase. Google has guaranteed several landlords' lease income, where the sizing tells you exactly what is being protected: at three sites, the guarantee equalled the landlord's note principal to the dollar, covering between 0.14 and 0.48 times the rent those leases actually owe. Bondholders are insured. Landlords, at the back end, are not.
My read is unsentimental. This structure is far better credit than the 1999 merchant power build, because that build was uncontracted where this one is anchored by investment-grade counterparties. Fragility has not disappeared; it has migrated. It used to sit in the turbine. Now it sits in the guarantee, a smaller, less visible, considerably more correlated place for it to sit.
Politics of a Visible Rent
Every scarcity rent survives exactly as long as it stays invisible. This one arrives monthly, in an envelope, addressed to a voter.
After more than a decade of flat demand, US electricity production grew 2.5% in 2024, 2.4% in 2025, then 3.0% year on year by March 2026. Consumer electricity prices rose 4.6% over that last comparison. Average residential rates climbed nearly 5% between 2024 and 2025 with another 4% forecast into 2026, on a brutally uneven distribution: Pennsylvania retail power rose 21.7% during 2025 against a national average of 8.3%. Dominion filed its first base-rate increase since 1992. None of this is subtle to the household paying it.
Attribution matters more than accuracy in politics. Data centres are being blamed whether or not the blame is proportionate. Data Center Watch counted at least 75 projects blocked or delayed nationwide, worth about $130 billion, in the first quarter of 2026 alone, the largest three-month figure since it began tracking in 2023, with opposition groups more than doubling to 833 across 49 states. Roughly 34 gigawatts of planned capacity now sits classified as stranded or delayed, and Virginia, the industry's own heartland, has passed a per-kilowatt-hour tax aimed specifically at AI facilities.
Stephen Byrd, who runs thematic research at Morgan Stanley, called the trajectory before the midterm cycle sharpened it.
"We expect national attention on this issue to grow heading into the midterm elections in the U.S., as affordability is often a top voter issue and recent elections were in part won by candidates running on cost-of-living issues."
Stephen Byrd, Global Head of Thematic Research, Morgan StanleyWhat makes this dangerous for the merchant layer is that it does not divide on party lines. Rural Republicans object to server farms consuming farmland and grid headroom; urban Democrats represent constituents who cannot absorb another rate increase. Rate cases are calendared in Michigan, Arizona and Ohio, all of them politically contested. Any rent that requires a commission's forbearance is, functionally, a rent held at the pleasure of an electorate.
Developers read the room and responded the way industries do, by leaving. Faced with a seven-year queue in Virginia, they stopped waiting for the grid. They built their own generation instead.
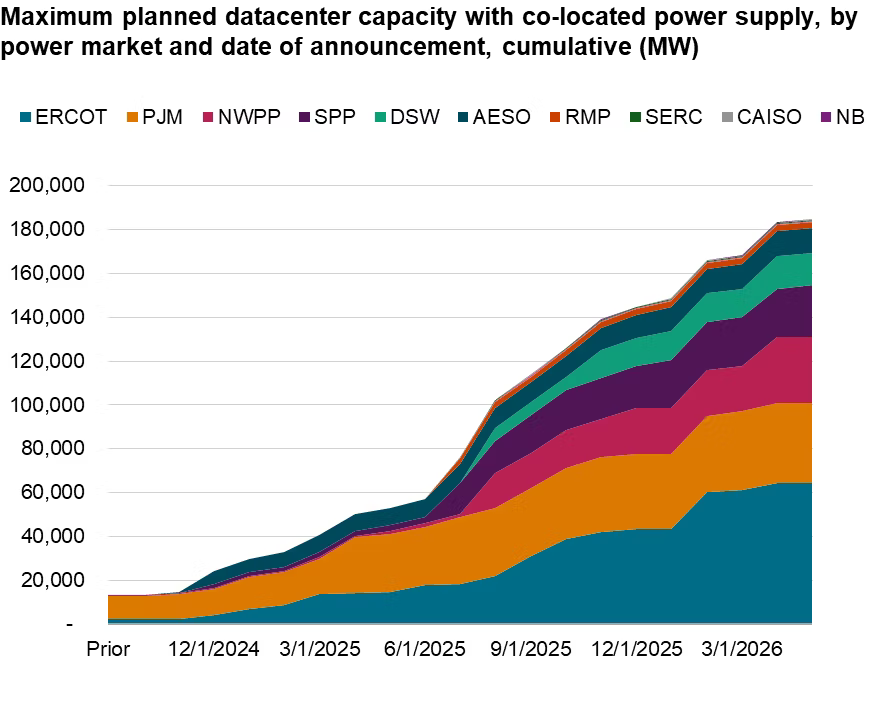
Behind-the-meter generation is now expected to serve about 25% of new data centre demand by 2030, with S&P tracking 134 projects planning to co-locate supply. Roughly a third of planned US capacity is expected to include on-site generation. xAI ran the logic to its conclusion in Memphis, building a 1.2 GW gas plant and operating off-grid rather than joining a queue. Amazon has been reported building a private gas grid in West Texas at several times that scale.
Before treating that as a permanent structural shift, look at how the same analysts model it over a longer horizon.
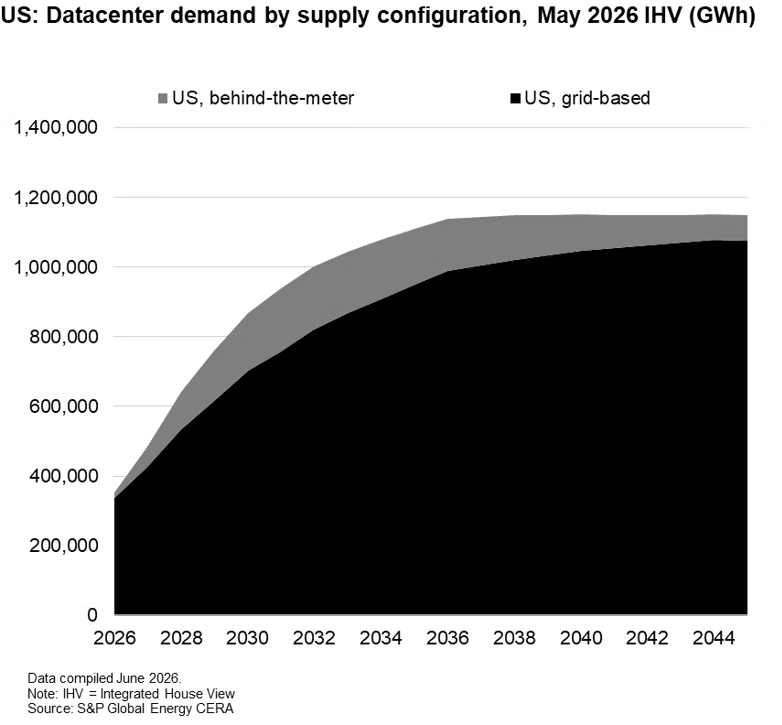
That chart is the single best argument for reading this bottleneck as transitional rather than structural. I take it seriously. It is also the pivot into the strongest case against everything I have argued so far.
Bear Case, Steel-Manned
Let me put the opposing argument as forcefully as its proponents do, because parts of it I find genuinely persuasive.
First: system adapts...and is already adapting. Tony Kim, who runs BlackRock's global technology team, ran a full review of AI power supply and answered the derailment question with a flat no. Gas turbine manufacturing is scaling and can scale further. Solar deploys in months. Fuel cells are contributing. Batteries raise the effective yield of generation that already exists. Through 2026 and 2027, in-flight capacity plus interim solutions look sufficient; beyond 2027 the question shifts from whether power exists to how quickly capital converts into energised capacity. Kim's most interesting claim is that the frictions are useful: they act as a self-regulating mechanism that caps expansion, forces capital toward the highest-return projects, and reduces the risk of indiscriminate overbuilding.
Second: scarcity may be a scheduling problem. Emerald AI's chief executive Varun Sivaram makes the sharpest version of this. American grids sit near 99% spare capacity for the overwhelming majority of hours, with congestion concentrated into a handful of peaks, which the DOE's own $11 billion figure confirms by noting most of it occurs in 5% of operating hours. If large loads flex during those rare hours, roughly 100 GW fits onto the existing system without a trillion dollars of new steel.
This is no longer theoretical. On June 18th FERC issued show-cause orders to all six regional grid operators, finding explicitly that none offers a transmission service designed for flexible large loads, and Texas already requires large loads to demonstrate curtailment capability. Proof the physics work exists, uncomfortably: in July 2024 a voltage fluctuation in northern Virginia caused 60 data centres to disconnect simultaneously, dumping a 1,500 MW surplus onto PJM and forcing emergency action to prevent cascading outages. Data centres can shed load in seconds. Whether that becomes a tariff product or stays an accident is the open question. BloombergNEF modelling has full flexibility compressing exactly the wholesale spreads merchant generators are valued on.
Third: efficiency has a long record of winning. Google reported data-centre emissions down 12% in 2024 while data-centre electricity consumption rose 27%, and claims its facilities now deliver more than six times the compute per unit of electricity they managed five years ago. IEA's High Efficiency case has 2035 data-centre demand 20% below base, with a full range spanning 700 to 1,700 TWh, a spread so wide it should embarrass anyone quoting a point estimate.
Fourth, and hardest: the grid was always going to need this money. American transmission and distribution assets average some 55 years old, so replacing that base raises bills with or without a single new server. Against that replacement bill, what data centres spend directly is a rounding error, which would make the "AI power supercycle" substantially a rebranding of maintenance capex that was always due.
Fifth: it is already in the price. Vertiv rose 102% during 2026 and GE Vernova 65%, the latter up around 700% since its spin-off. Whatever scarcity premium exists has been discovered, crowded and capitalised. A two-to-three-year pricing window extrapolated into perpetuity is exactly how infrastructure cycles end.
Where I think that case breaks
Points three, four and five I substantially accept. They shape my position rather than contradict it. Efficiency is real, replacement capex is a large share of the spend, and the equipment names are no longer cheap. Anyone telling you this is an undiscovered trade in August 2026 is not reading the tape.
Points one and two are where I part company, for a reason the bear case elides: flexibility solves the energy problem while doing nothing whatsoever to the equipment problem.
You can schedule a training job. You can curtail a load during a peak hour. You cannot schedule a large power transformer into existence. Sivaram's own hundred gigawatts still has to arrive at a substation through iron that has a two-to-five-year lead time and is largely manufactured abroad. FERC's June orders concern transmission service and interconnection procedure, not manufacturing capacity. Every flexibility scenario I have read assumes the physical delivery hardware exists; none of them build it.
Same objection applies to the efficiency argument. Franklin Templeton's data makes it visually.
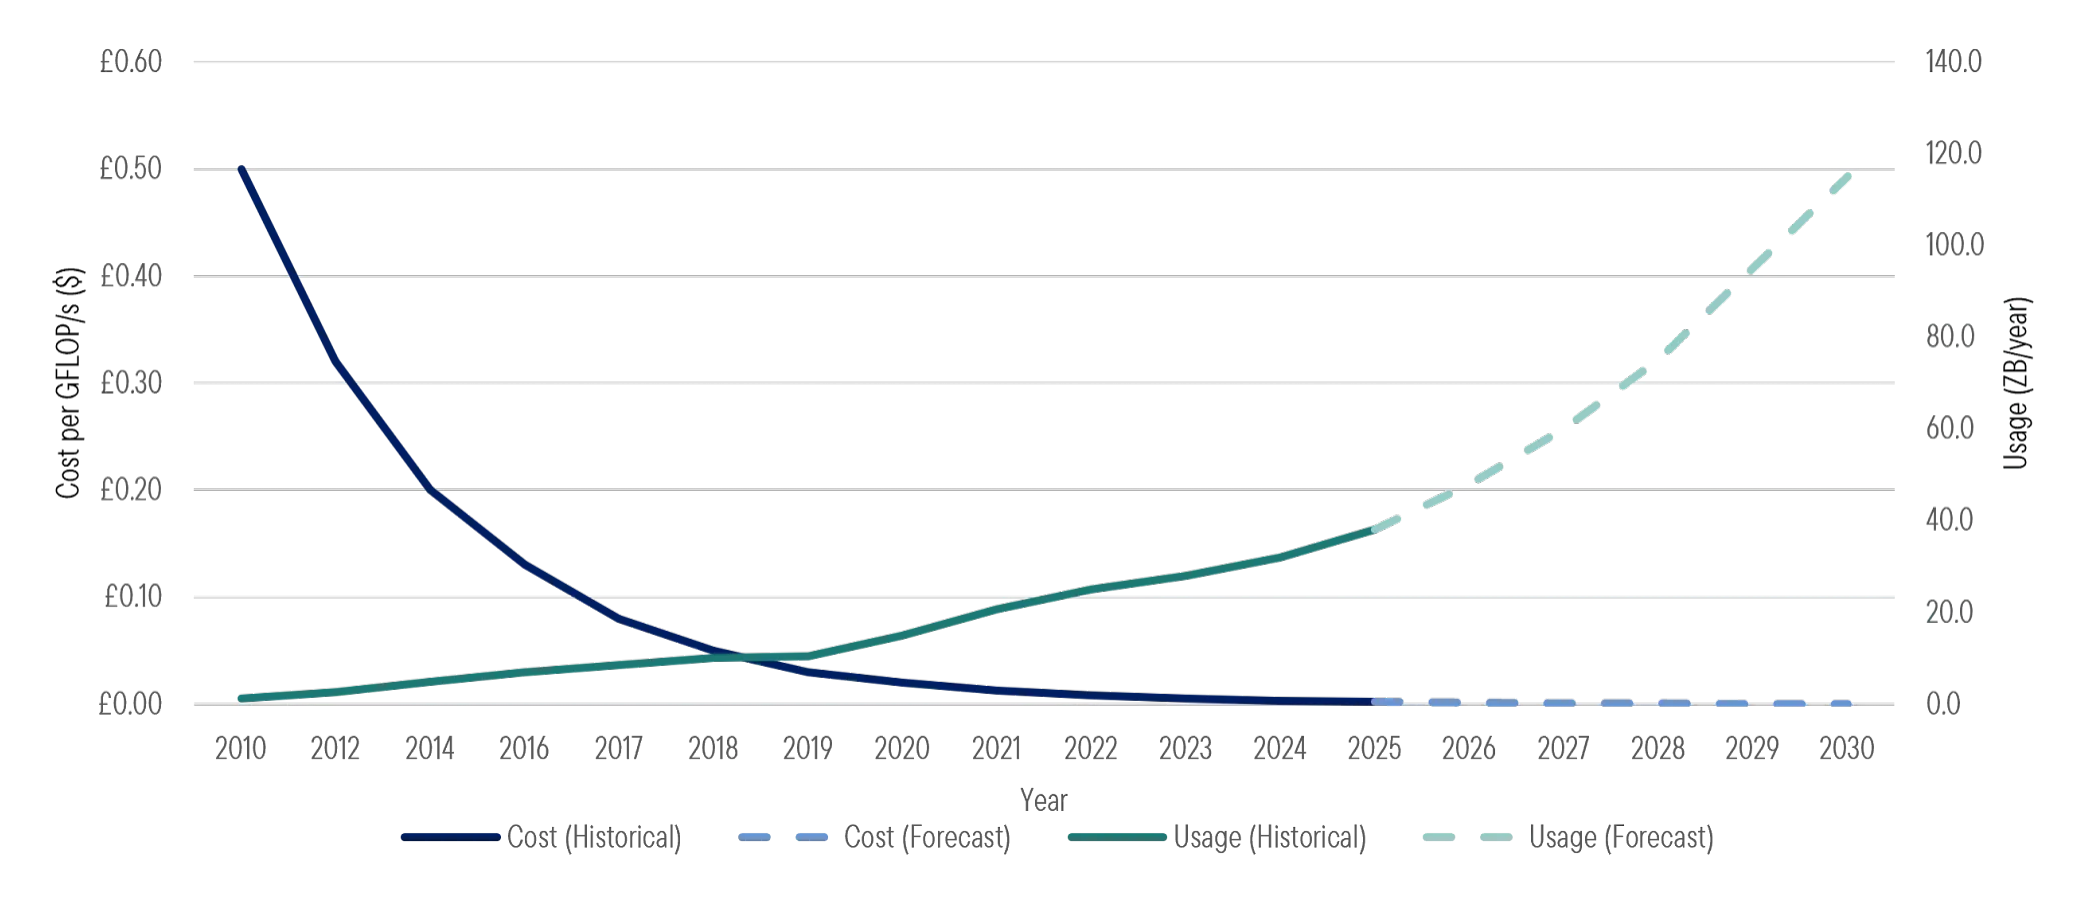
Google's own numbers illustrate it neatly. Six times the compute per unit of electricity, yet consumption still rose 27% in a single year. Efficiency has never once reduced this industry's total draw, so the burden of proof sits with whoever claims this cycle is different.
On the crowding point, my answer is narrower than a defence. Being fully priced is a reason to think hard about entry and about which specific businesses inside the layer have durable rather than cyclical advantage. It is not a reason to reclassify who captures the economics, which is the question this study set out to answer.
Scenarios and Signals
Forecast ranges in this industry are absurdly wide. Honesty requires saying so. IEA's base case has global data-centre consumption doubling from 415 TWh in 2024 to about 945 TWh by 2030, with a 2035 spread running 700 to 1,700 TWh across its sensitivity cases, while institutional US estimates for 2030 range from 200 to over 1,000 TWh depending on methodology. A review of 258 published data-centre energy studies found systematic methodological defects across the literature. Anchors move fast, too: the Berkeley Lab study that framed this whole debate in December 2024 put 2028 US demand at 74 to 132 GW, and analysts revised their estimates upward by about 36% in the twelve months to April 2026 alone. Anyone quoting a single number to three significant figures is selling something.
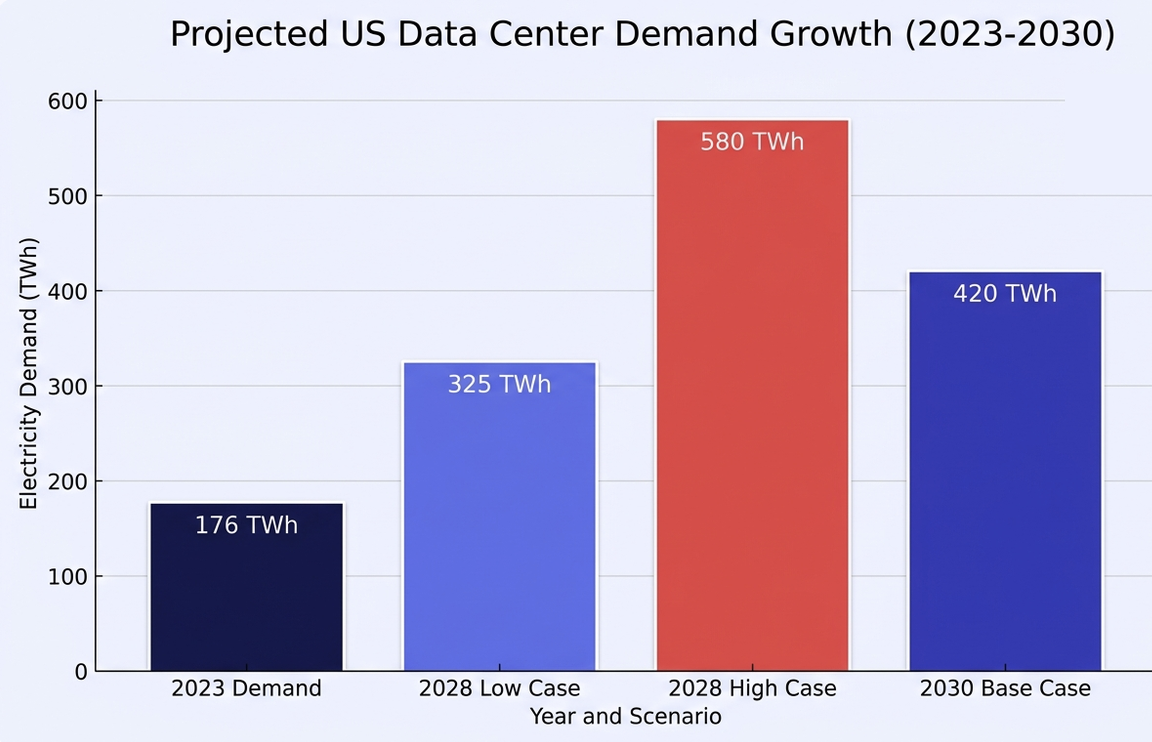
With that caveat stamped on the front, here is how I weight the next three to four years.
Constraint persists through 2029 without breaking. Equipment backlogs convert, turbine and transformer lead times stay long, behind-the-meter carries the bridge, and grid additions gradually catch up after 2030 much as S&P models.
Who wins: equipment and engineering keep pricing power longest. Utilities compound rate base at allowed returns. Merchant power earns well but under a visible political ceiling. Compute landlords survive on guarantor credit.
Affordability wins the midterm argument. Caps become permanent, large-load tariffs shift upgrade costs onto data centres, moratoriums spread beyond the current 13 states, and the 34 GW already stranded grows materially.
Who wins: equipment still ships, because the wires get built regardless of who pays. Merchant generators de-rate hardest, since their entire thesis is the rent being confiscated. Landlord leases signed at today's rates look expensive.
A hyperscaler cuts guidance rather than merely being questioned about it. Alphabet's negative quarter becomes a pattern, credit markets tighten on the $1.2trn of off-balance-sheet exposure, and orders convert to cancellations.
Who wins: nobody in this study, though not equally. Backlog duration cushions equipment for a year or two. Levered compute landlords and speculative uncontracted generation break first.
FERC's flexible-load reforms scale quickly, large loads curtail reliably during peak hours, and roughly 100 GW absorbs onto existing infrastructure. Congestion rent collapses; spreads compress toward BloombergNEF's modelled outcome.
Who wins: hyperscalers and ratepayers. Merchant generation is worst hit. Equipment demand falls least, because flexible load still needs delivery hardware at the node.
Read those four together and one pattern repeats. Equipment survives every scenario in better shape than any other layer, including the ones where the thesis is wrong, because grid hardware gets bought whether the load is served flexibly, expensively or not at all. That asymmetry, rather than any demand forecast, is the actual argument.
Investment Implications
Chapter III delivered the verdicts. What it did not give you is a way to tell a good business inside a good layer from a bad one, which is where most of the money is actually won or lost. Three practical tests, then two groups the study has not yet named.
Inside the equipment layer, ask whether backlog is growing faster than revenue and lengthening, because a shortening backlog at rising revenue means the shortage is easing. Ask whether margins expand alongside volume or get handed back to input costs. And ask whether a service annuity stands behind the hardware sale, since the installed base is usually where durable margin lives, running at multiples of the margin on the original turbine.
Inside the regulated layer, jurisdiction outranks every other variable. Identical assets earn very different returns under a constructive commission and a hostile one, with hostility increasing. Which states let utilities recover large-load costs from the large loads themselves is the mechanism that decides whether growth is accretive or merely large.
Inside merchant generation, separate contracted output from uncontracted exposure, even within a single company. Those are two different securities wearing one ticker, and the split between them tells you more than any headline multiple.
Two groups deserve naming before the scorecard, because neither appears in the layer table.
First, power-intensive industry standing next to a data centre, which nobody discusses as a loser and which plainly is one. Aluminium smelting, chemicals, steel, cold-chain logistics and industrial gases buy the same commodity at the same regional price. None have a hyperscaler's ability to pay. Where retail power rises 20% in a year, somebody's cost curve moves. It is not the buyer with a trillion-dollar balance sheet.
Second, Europe, a cleaner expression of the same theme than the US market. Bank of America's basket of European AI adopters returned 14% during 2026 against 3% for US hyperscalers. Grid equipment is a European and Asian manufacturing competency more than an American one. EU data centre demand is projected to rise from 70 TWh in 2024 to 115 TWh by 2030. Second-order beneficiaries have outperformed first-order names for months, in the market that owns fewer of the first-order names. European fund managers, meanwhile, name energy price shocks as their single largest downside risk at 41%, which is a positioning fact as much as a macro one.
Scorecard
A study that cannot be marked wrong is entertainment. So here is the piece reduced to seven questions, each with the observation that would confirm my reading and the observation that would break it. Read the right-hand column as seriously as the left. Two or three of those firing together is the point at which I would be rewriting this rather than defending it.
| Question | Confirming signal | Warning signal |
|---|---|---|
| Is demand real, or booked? | Watch for backlog conversion holding while new contracted capacity keeps signing. Picks-and-shovels backlog has compounded near 34% against a historical norm around 5%. | Watch for that growth rate reverting toward normal, or orders quietly reclassified rather than cancelled. Backlog conversion cannot be faked; order announcements can. |
| Is power genuinely scarce? | Watch for interconnection queues staying long and withdrawal rates staying near half. Northern Virginia still quotes seven years. | Watch for a rapid supply response. A PJM auction clearing below $325 with the reliability requirement met, and new generation materially above 524.7 MW, is the first real evidence of elasticity. |
| Can equipment hold its price? | Watch for turbine reservations sold out through 2030 and transformer quotes staying at two to five years. | Watch for reservation holders reselling slots, price concessions to fill 2029 and 2030, or transformer lead times easing back toward twelve to eighteen months. |
| Can utilities earn on the build? | Watch for commissions approving large-load tariffs that recover upgrade costs from the data centres causing them. | Watch for rate cases denied on affordability grounds. Michigan, Arizona and Ohio are calendared and politically contested. |
| Does the rent survive politics? | Watch for PJM's price cap sunsetting on schedule without a replacement mechanism. | Watch for caps made permanent, more states joining the current 13 with moratoriums, or the 34 GW already stranded growing through the midterms. |
| Is the capex funded or financed? | Watch for hyperscaler free cash flow staying positive on a trailing basis while capex grows, with bond issuance clearing without spread concession. | Watch for an actual guidance cut, not analyst scrutiny. Alphabet's negative quarter repeating, or credit tightening against the $1.2trn of off-balance-sheet exposure. |
| Does flexibility change the physics? | Watch for FERC's compliance filings producing nothing a hyperscaler will actually sign, leaving iron as the binding constraint. | Watch for a working flexible-load tariff signed in gigawatt quantities. Congestion rent compresses first, merchant generation next. |
Weighting matters more than the list. Question one is the one I would act on first, because backlog is the only variable here that leads the cycle rather than confirming it. Question seven is the one most likely to embarrass me. It is the reason my base case is a grind rather than a boom.
What this study is actually about
One last thing, the part worth keeping after the electricity numbers go stale.
Nothing in the argument above required the bottleneck to be power. Swap electricity for high-bandwidth memory, advanced packaging, rare-earth separation, port capacity, or whatever the market decides is scarce in 2029: the machinery runs identically. A shortage appears. Money floods toward whoever stands nearest to it. And the returns land somewhere else entirely, in a place nobody was looking, because proximity to a shortage is not the same thing as the ability to charge for it.
3 questions travel to any bottleneck you meet, in this order.
- Which clock does revenue run on, and which clock do costs run on? Revenue faster than costs is where excess return lives. Reversed, it is where losses live. Equal, and you have a bond.
- Who owns the asset when the scarcity ends? Whoever holds it eats the residual value. Selling into a shortage and walking away beats owning through one, almost every time.
- Who is legally entitled to take the rent? If the answer is a regulator, a legislature or an electorate, the rent is a loan. Visible rents get repriced by people who did not sign your contract.
Apply those three to this cycle. An answer arrives quickly. Equipment and engineering pass all three. Landlords pass one. Utilities fail the third by design. Merchant generators are discovering they fail it in practice.
Which returns us to Jensen Huang, who described AI infrastructure at this year's GTC as a five-layer cake and named the bottom layer without hedging.
"Energy is the first principle of AI infrastructure and the binding constraint on how much intelligence the system can produce."
Jensen Huang, Chief Executive, NVIDIA, GTC 2026He is describing a constraint, not an opportunity, and that difference is the entire study. Constraints create rent. Whether the rent reaches a shareholder depends on contract length, regulatory tolerance and who is holding the asset when it stops being scarce. On current evidence the layer that renegotiates every ninety days is winning, the layer that locked in for fifteen years has already banked whatever it is going to get, and the layer whose price is set by a commission is discovering how quickly a rent becomes a rebate.
Ian Andy, Bellwether Research Desk, August 22nd 2026