Every trading desk I talk to right now repeats some version of the same line: money is leaving tech. Small caps are up more than double the S&P this year. Health insurers are outrunning semiconductors. Real estate rose 3% in the same week the S&P fell 2%. Gold, of all assets, is sitting out the party entirely. String enough of that coverage together and a narrative writes itself: investors got scared of artificial intelligence and capital is fleeing for the exits.
I don't buy that narrative. Not because the numbers are wrong, they aren't, but because the story built on top of them is incomplete.
What's actually happening in this market is stranger and more interesting than a simple flight from AI. Capital isn't leaving the trade. It's finding new places to live inside it. Memory chips and custom silicon are picking up where GPU makers are pausing for breath. Utilities and industrials are quietly repricing on the same electricity demand that built the last two years of Nvidia's income statement. Even the Russell 2000, supposed refuge of unloved small-cap value, turns out to be carrying a $77 billion company that sells fuel cells to data centers. Rotation, in other words, is not the opposite of the AI trade. It's the AI trade putting on a different jacket.
A real fault line sits underneath all of this and has nothing to do with whether artificial intelligence works. It's about who gets paid for building it and whether the five companies footing most of that bill can keep footing it once their own cash flow statements stop cooperating. That tension, more than any headline about sector leadership, is what this study is built around. I went through twenty-six separate sources researching this piece, institutional research, sell-side notes, financial media at every quality level, looking for where they agree, where they contradict each other and what they collectively miss. Here's what I found.
Crossover Nobody Priced In
Start with Oracle, because Oracle already crossed the line its peers are still approaching.
Oracle's fiscal 2026 operating cash flow came in at $32.0 billion. Its capital expenditure for the same year hit $55.7 billion. Free cash flow...negative $23.7 billion. Therefore, one of the largest AI infrastructure builders on the planet is now funding growth with debt and equity, not its own operations, a shift the market noticed almost immediately.
There is a clean way to frame this pattern - the crossover point, the moment a hyperscaler's cash capital expenditure overtakes its operating cash flow. Epoch AI's modeling has aggregate hyperscaler cash capex compounding near 70% a year against operating cash flow growth closer to 23%. Run that math forward and the crossover for the group lands around the third quarter of 2026. Oracle got there early. Amazon is sitting right on the line, Q1 2026 capex of $44.2 billion against operating cash flow of $26.0 billion, trailing free cash flow barely positive at $1.2 billion. Alphabet, Meta and Microsoft remain on the healthier side of the ledger for now, but Epoch's own company-by-company timeline puts Alphabet's crossover at Q1 2027, Meta's at Q3 2027 and Microsoft's, most conservative spender of the five, at Q3 2028.
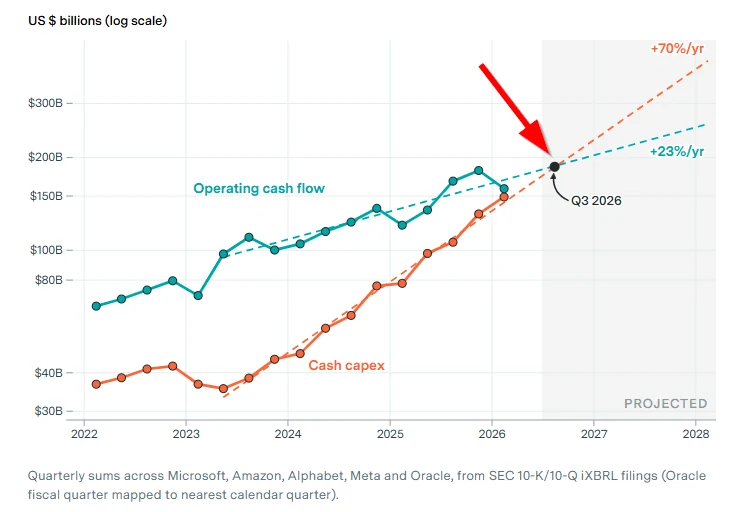
Company-by-company modeled point where cash capex overtakes operating cash flow, per Epoch AI data. Read the spacing, not the exact quarter: Oracle and Amazon crossed already, the other three have roughly seven, thirteen and twenty-five months of runway left on current trend lines, a staggered schedule the market has started trading well before any of these three confirm it on an earnings call.
That staggered timeline matters more than any single number in this piece. It means the AI capex story isn't breaking all at once. It's breaking company by company, on a schedule you can actually write down, one the market has started trading months before earnings calls confirm it.
Alphabet is the clearest illustration of why. Its 2025 capex jumped 74.1% to $91.4 billion and free cash flow still grew, barely, up 0.7% to $73.3 billion, because operating cash flow rose right alongside it, up 31.5% to $164.7 billion. But 2026 guidance calls for $180 to $190 billion of capex, roughly double the 2025 level and about $20 billion more than all of last year's operating cash flow combined. AllianceBernstein's Nelson Yu ran the arithmetic in his July 3rd outlook: even a generous 30% increase in operating cash flow only gets Alphabet to about $29 billion of free cash flow, a roughly 60% year-over-year decline. Alphabet is paying for that gap the same way Oracle already is: roughly $76 billion of new notes issued across late 2025 and early 2026, on top of an $84.75 billion equity raise. Debt and dilution at the same time, from a company that started 2025 with only $10.9 billion of long-term debt on its books.
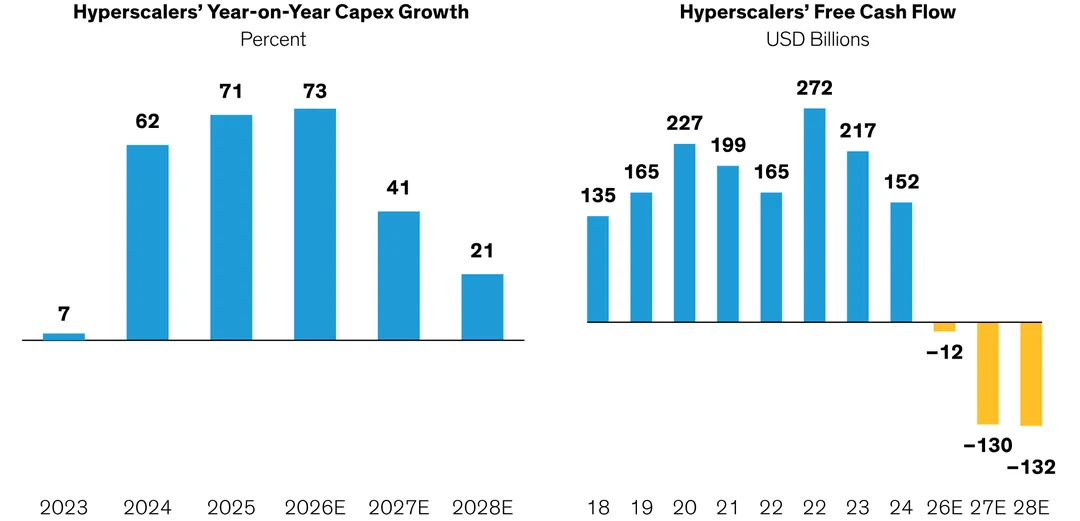
None of this means AI stopped working. Alphabet's operating cash flow is still growing at 31.5%. Technology still led global sector performance outright in the second quarter, ahead of industrials, financials and everything else. What changed is simpler and, for a stock picker, more useful: market has stopped rewarding capex announcements on faith and started pricing the gap between spending and cash generation, name by name, quarter by quarter.
Evidence of that discipline showing up in real assets, not just spreadsheets, arrived within days of each other in late June and early July. Blackstone sold its stake in a portfolio of AI data centers to Digital Realty for $3.5 billion, funded in part by a $2.2 billion secondary offering from Digital Realty itself. Blackstone is also reportedly walking away from an 800-acre data center campus in northern Virginia, following Brookfield-backed Compass Datacenters, which pulled out of a similar project in late April. SpaceX, meanwhile, started renting out Colossus 1 and 2, data centers it built for xAI, after demand projections for xAI's own compute needs didn't pan out. Meta is reportedly considering the same move with its excess capacity. When that story leaked, Meta shares rose 10% on the day. Read that reaction carefully - market didn't punish Meta for admitting it overbuilt, it rewarded the company for showing capital discipline. There is an old market adage: equities ride the escalator up and the elevator down. Investors just found out some hyperscalers are willing to get off the escalator early. For now, at least, they're applauding it.
One more point sets up everything that follows. Crossover squeezes spenders, but it does not shrink the spend: Morgan Stanley pegs total data-center capital outlays near $2.9 trillion over 2025 to 2028, roughly $1.6 trillion of it hardware. That river of money still has to land somewhere. Increasingly it lands one layer down from mega-caps, on the semiconductor, memory, power and cooling suppliers that get paid whether or not the hyperscalers ever earn a return, which is exactly where the rest of this study goes next.
Mapping Capital's New Addresses
Piper Sandler's chief market technician, Craig Johnson, gave this rotation a name back in June: mega rotation, capital aggressively shifting from lagging mega-cap tech into cyclical and value sectors. Numbers back him up and arrived in waves rather than one clean signal. Traders Agency's own thirty-day ETF tracker, published in early June, caught the earliest snapshot: XLV up 6.97% against XLK's 1.36%, a spread the firm called the clearest evidence of the rotation in action, twelve days before anyone was using the phrase mega rotation in print.
| US Sector (ETF) | 1-Month | 3-Month | 6-Month | 1-Year |
|---|---|---|---|---|
| Health Care (XLV) | +7.19% | -0.30% | +2.56% | +14.65% |
| Energy (XLE) | +5.66% | +4.49% | +28.78% | +40.84% |
| Real Estate (XLRE) | +1.78% | +5.17% | +11.61% | +7.98% |
| Financials (XLF) | +2.38% | +4.23% | -1.54% | +2.86% |
| Technology (XLK) | +1.49% | +27.45% | +20.34% | +48.73% |
Focus on right two columns, not the left one - technology's one-month number is the smallest in the table, but its six-month and one-year returns still dwarf every other sector here. That's a rally cooling, not reversing, sitting on top of gains this large the laggard month barely registers. Source: Liquidity Desk, June 2026
Liquidity Desk's own framing of that table captures the point better than I can improve on: this is a cooling after an exceptionally strong rally, not a reversal, with capital simply looking elsewhere, temporarily. I'd add one word. Selectively, not just temporarily.
Selectivity like that is easiest to see in market breadth, one level below the sector ETFs. Equal-weight S&P 500 returned 11% year-to-date as of late June against 7% for the cap-weighted index, a gap Piper Sandler reads as a rotation-into-value signal rather than statistical noise. eToro's Lale Akoner adds a technical detail most coverage skipped: 63% of S&P 500 constituents and 70% of S&P 600 small caps were still trading above their 200-day moving average as of June 29th, even after the pullback in mega-cap names. Her point, well made: if this were the start of a genuine bear market, smaller companies would historically weaken first, not hold up better than the index. They didn't, which argues against the fear-driven reading of this rotation and toward something closer to ownership rebalancing.
Ownership rebalancing is exactly the mechanism Akoner names. Technology absorbed most of the market's new capital over roughly the past two years, leaving financials, industrials, healthcare, real estate, utilities, energy and smaller companies relatively under-owned. Capital isn't fleeing a bubble in this framing, but rather filling a vacuum. Regional bank ETFs KBWB and KRE hit fresh highs in late June despite a flatter yield curve, industrials strengthened on capex-exposure and healthcare broke higher after an extended period of lagging, three sectors moving together in a pattern Akoner reads as growing confidence in the domestic economy, not fear of recession.
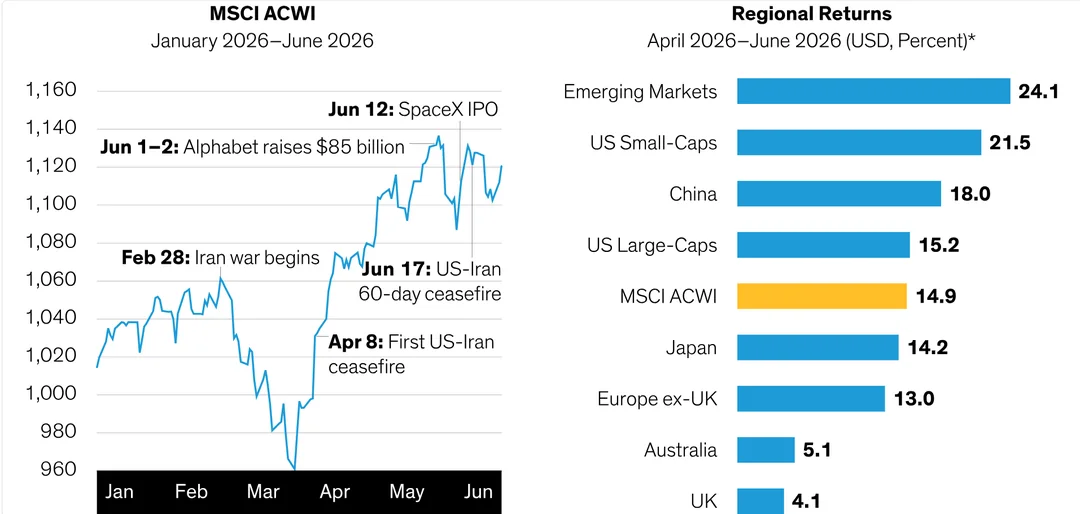
That same broadening shows up one level higher, across whole regions. It is not a US-only story. AllianceBernstein's second-quarter scorecard puts emerging markets up 24.1% and US small-caps up 21.5%, both comfortably ahead of US large-caps at 15.2% and the MSCI ACWI benchmark at 14.9%. China returned 18.0%, Japan 14.2%, Europe ex-UK 13.0%. Those mega-cap US names that led for two years sat mid-pack. Therefore whatever is underway is bigger than a reshuffle inside the S&P 500 - capital is broadening by geography and by company size at the same time, which is the footprint of a liquidity-and-positioning rotation rather than a US growth scare.
Real estate makes the same point with better granularity. In the last week of June, real estate stood as S&P 500's third-best sector, trailing only health care and utilities, while broader index fell 1.96%. Health care REITs led with a 9.78% weekly gain and a 21.33% year-to-date return; Welltower rose 10.01% to $227.33; Healthpeak Properties climbed 10.17% on a JPMorgan price-target hike to a 52-week high. UBS's own thesis for the sector, that AI stands to improve profitability across much of healthcare and reward large operators that invest aggressively, reframes healthcare real estate as an AI beneficiary rather than a purely defensive parking spot. Hotel and resort REITs, boosted by major sporting events and a strong US travel year, are up 40.4% year-to-date, best subsector return in the whole real estate complex.
None of this rotation is uniformly clean. A good analyst doesn't pretend otherwise. Blackstone Mortgage Trust fell 3.65% the same week after a $159 million Chicago office loan, originated back in 2018, defaulted at maturity. Office real estate remains negative year-to-date even after the week's bounce. E*TRADE's own June client-flow data complicates the picture further: retail investors were net buyers of communication services, up sharply to a 14.71% net-buy reading from just 0.14% in May, and real estate, but net sellers of financials, down 8.03%, single largest net-sell reading of any sector that month. That directly contradicts the rotation-into-financials framing running through several other sources in this study. I'm not going to paper over the contradiction. Institutional flows and retail flows are, for June at least, reading this rotation differently. Institutions appear to be buying banks. Retail, at least the E*TRADE cohort, was selling them.
Real assets caught this rotation earliest. By June 11th, tech's correction was already visible, QQQ down 6.96% and XLK down 10.93% since June 2nd, alongside a detail most coverage missed entirely: gold and silver were not safe havens in that selloff. GLD fell 12.97%, GDX 23.29%, SLV 27.36% over the same four weeks, hit by the same higher-for-longer rate repricing that hit tech. What held up instead was infrastructure and real estate, unglamorous, inflation-indexed, AI-adjacent without being AI-labeled. Brookfield Renewable Partners returned 33.93% year-to-date as of that date, Brookfield Infrastructure Partners 14.84%, Realty Income 12.60%, all riding the same data-center power and cooling demand that built the semiconductor trade, just one supply-chain layer removed from it. Less visible version of the same signal showed up on June 17th in an Investors Hub interview with Bruce Campbell, who noted healthcare and smaller-cap stocks beginning to show improving relative strength beneath tech's continued nominal leadership, alongside an easily missed detail: copper miners starting to outperform gold miners on his own long-term momentum indicators, a rotation inside the commodity complex nobody else in this study's source set flagged.
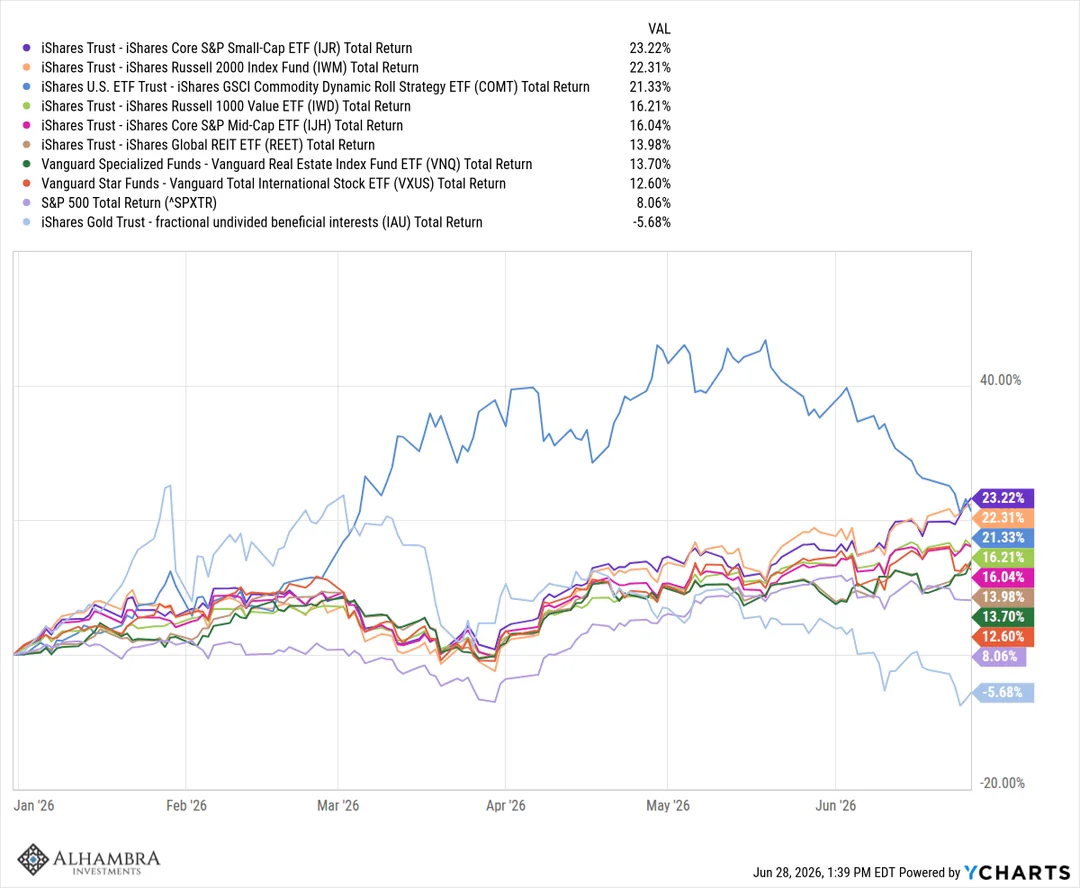
Widen the aperture to every major asset class and 2026 leaves an unusually clean signature. Laid out as a year-to-date scoreboard in a single chart, it runs like this: small-caps up 23.2%, Russell 2000 up 22.3%, commodities up 21.3%, Russell 1000 Value up 16.2%, with mid-caps, global REITs, US real estate and international equities all bunched between 12% and 16%, with the cap-weighted S&P 500 itself trailing the field at 8.1%. One asset class, only one, finished the stretch underwater - gold, down 5.7% after round-tripping from a gain north of 40% earlier in the year.
Put a number on how healthy all this looks and you get 76 out of 100. That's the live Sector Health Score from The Trading Tools' rotation dashboard as of July 2nd, built from the share of US sectors trading above their own 50-day average, currently 73%. Their own scoring bands put anything from 75 to 100 in Healthy territory, 55 to 75 as Mixed, anything under 35 as outright Risk-Off. 76 is not a marginal healthy reading. It sits comfortably inside the top band: a number, not a vibe, which is more than most of the rotation headlines in financial media bothered to produce.
Rotation in Disguise
Here is where this study's thesis actually crystallizes. It comes from doing what most rotation commentary skips - reading what actually sits inside the indexes everyone keeps quoting. Stated plainly...this market looks like it's rotating away from AI into small caps, value and international names, but dig into what actually sits inside those indexes and the AI theme hasn't been abandoned. It's spread into them.
Look at the top 25 holdings of the Russell 2000, small-cap index everyone keeps citing as proof capital fled to safety. Sixteen of them carry a direct AI connection. Its single largest holding, Bloom Energy, carries a market capitalization of $77 billion, which by no honest definition qualifies as a small-cap stock. Bloom sells fuel cells for behind-the-meter data center power. It IPO'd in 2018 at $15, cratered to $2.67 by late 2019, round-tripped to $25 by the summer of 2025, then rocketed as high as $345 on data-center demand before settling near $252. Revenue is growing 130% year over year. It also trades at 117 times next year's earnings and 20 times sales on an 8% operating margin, numbers that belong to a growth-stage AI infrastructure story, not a value stock riding a defensive rotation. Yet it sits inside the Russell 2000, distorting every small-caps-are-winning headline built on that index's return.
Same pattern, different index. Russell 1000 Value's top 25 holdings include Micron, Google, Amazon, Intel, Applied Materials, AMD and SanDisk, a lineup that reads more like a semiconductor watchlist than a value fund. Even real estate isn't clean ... three of the top six MSCI real estate names and three of the top five Dow Jones real estate names carry direct AI ties, almost certainly the same data-center power and cooling REITs discussed a section ago. VanEck's own BUZZ index data adds the sharpest single confirmation I found anywhere in this study: over the period from May 14th to June 11th, Nvidia fell 13.1% while broader semiconductor group, MVIS US Listed Semi 25 Index, rose 5.4%. Same underlying theme, opposite direction, inside the same four-week window. Money didn't leave semiconductors. It moved from the most crowded name in the group toward the ones crowd hadn't bid up yet. Micron up 249.1% year-to-date through that same date, Marvell up 230.7%, both riding memory pricing power and custom-silicon design wins that Nvidia, for all its scale, doesn't directly capture.
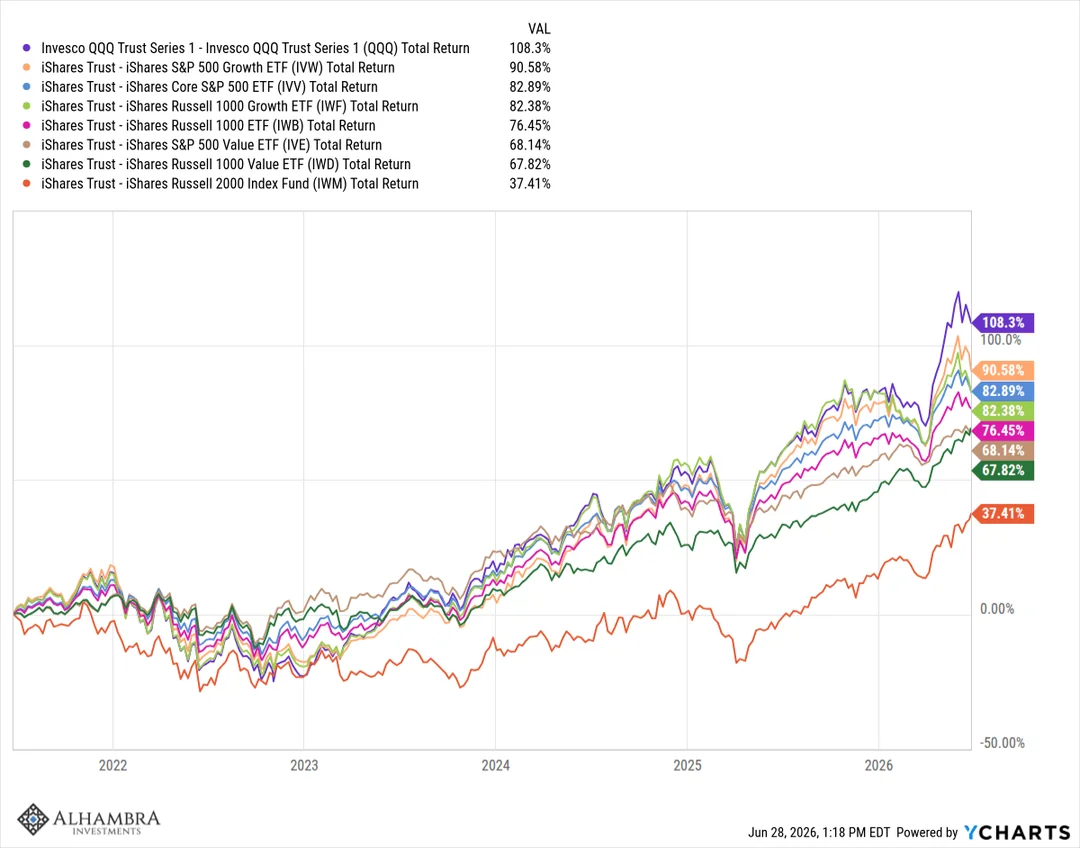
One more layer complicates tidy "small caps are winning" story, the easiest of all to miss - that leadership exists only in a short window. Stretch lookback to full multi-year run and the ranking flips outright. Over roughly past three years, Nasdaq-100 is up 108%, S&P 500 Growth 91% and Russell 2000 sits dead last at 37%. Compress same board to twelve months and small-cap value vaults to the top while large-cap growth sinks toward the bottom. That rotation into value is real, but it is a recent-window event perched on top of a multi-year regime that never stopped favoring large growth, which is precisely why it reads as fragile the moment you zoom out.
"Investors are still keen to be fully invested in equities but are rotating out of overheated semiconductor stocks into some overlooked sectors offering better value."David Morrison, Senior Market Analyst, Trade Nation
Look at the same question from ETF-holdings side and pattern holds. If this were a genuine rotation out of AI trade, two ETFs most exposed to it, QQQ and XLK, should show the worst damage of anyone. They didn't. QQQ slipped 3.2% on the month but was still up 13.5% over six months and 30.0% over the year. XLK, 99.4% technology, fell 2.1% on the month yet rose 23.9% over six. Those are not exactly the characteristics of a leadership group experiencing a sustained exodus of capital. Communication services, which looked like a rotation casualty on the surface, down 8.16% since the SpaceX IPO peak, turns out to be a concentration story instead: Meta and both share classes of Alphabet make up nearly a third of that fund's assets, so a rough month for two stocks reads on the tape as an entire sector rolling over. In a genuine rotation, one leadership group gets an outflow while another gets an inflow. One trend substitutes for the other completely. What's happening instead is addition. Industrials and small caps are joining the party. Tech never left it.
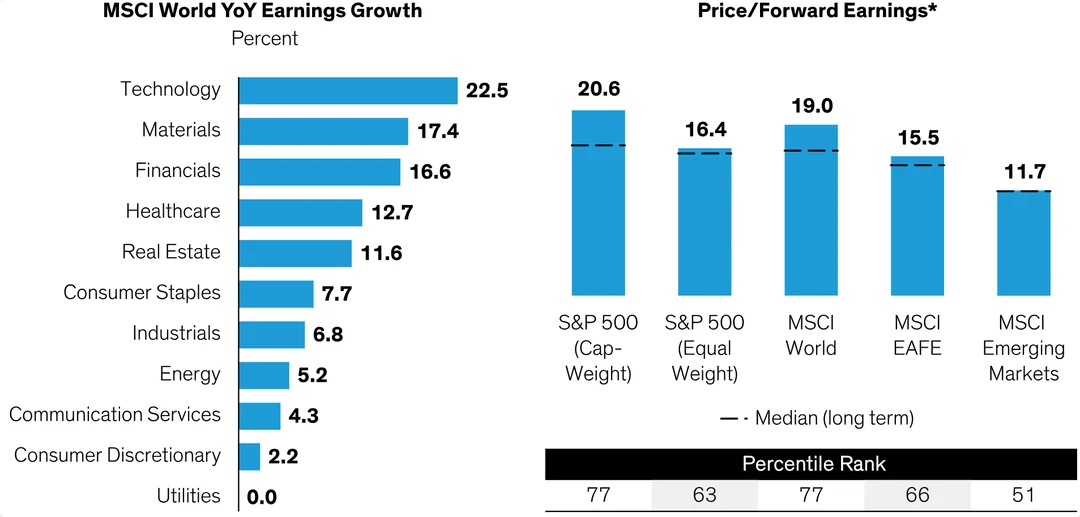
Which raises the obvious question any real rotation has to answer - if earnings are fine, why rotate at all? AllianceBernstein's valuation work supplies the cleanest answer I found. Technology still leads MSCI World earnings growth outright, up 22.5% year over year, so fundamentals did not crack. What has stretched is the price paid for them. On a cap-weighted basis, the S&P 500 trades at 20.6 times forward earnings, its 77th percentile going back two decades, while the equal-weighted S&P sits at 16.4 times (63rd percentile) and emerging markets at 11.7 times, barely above their own long-run midpoint. Expensive positioning is concentrated almost entirely at the cap-weighted top.
Two smaller data points round out the picture. Short interest is running hottest against speculative, second-tier AI names, SoundHound AI at 37.6%, C3.ai at 34.6%, BigBear.ai at 26.8%, clustered right alongside crypto miners MARA and CleanSpark. Skepticism about AI hasn't disappeared. It's just been repriced down-market, away from mega-cap infrastructure names and onto smaller, story-driven software plays that never had the balance sheet to back their multiples. And a One Day Advisor piece published June 23rd, one day after the Forbes mega-rotation story broke, recommended healthcare as the single best rotation destination for 2026 to 2027 without once mentioning that the small-cap and value rotation it was implicitly describing had already been running for weeks. Generic sector-rotation content, in other words, can miss a real, already-visible rotation entirely if it isn't built from the actual index constituents. This study is built from exactly that.
Same Jobs Report, Different Verdict
Same category of data point produced two opposite market reactions inside four weeks. That alone tells you how much of this rotation is about positioning rather than fresh information.
Start in early June. A strong employment report, 172,000 payrolls against an 80,000 estimate, raised fears the Fed would need to hike rather than cut and pushed CME futures toward meaningful hike odds for December, 42.9% probability on the 375-to-400-basis-point bucket, the single largest at the time. Inside AI-adjacent semiconductors, the reaction was violent. Chips led the damage as the Philadelphia Semiconductor Index shed 10% in its worst single session, with Broadcom down 12.6% and Marvell 17%, the latter just days after rallying 32% to $290.79 on Jensen Huang publicly calling it the next trillion-dollar company. Nvidia alone gave back $279 billion of market value, comparatively modest in percentage terms next to its peers. Measured across the AI chip complex, roughly $1.4 trillion evaporated. Wells Fargo's Ohsung Kwon summed up the mood bluntly: the semiconductor sector was way overbought. Cumulatively, from June 2nd, QQQ fell 6.96% and XLK 10.93%, tech officially in correction.
Healthcare and financials caught the other side of that same flow. UnitedHealth Group rose 5.2% in the very session that gutted the chips, the single cleanest stock-level illustration of growth-to-value rotation in everything I read for this piece.
Regime flipped entirely by early July. A weak June nonfarm payrolls print landed on July 4th, only 57,000 jobs added against a roughly 110,000 consensus, lowering Fed hike odds and eventually feeding cut hopes into the same day's trading. That print carried an odd wrinkle worth flagging: unemployment actually fell to 4.2% from 4.3%, not because more people found jobs, but because labor force participation dropped to 61.5% from an expected 61.8%, people left the workforce entirely. That is tricky for bulls, because markets need rate cuts to finance the AI buildout and a headline unemployment improvement, even a statistically hollow one, works against that. Weak jobs data still rattled AI-adjacent names hard: that week's chip damage ran to SanDisk down 19.6%, Teradyne down 18.5%, Western Digital down 16.2%, Micron down 14.3% for the week, materially larger than the single-day figures three weeks earlier. Two days ahead of that print, Asia side of the same contagion had already shown up: Kospi fell 7.89%, SK Hynix roughly 15%, Samsung roughly 9%, with eToro's Zavier Wong noting via CNBC that Samsung and SK Hynix together now make up around half the Kospi's total weight, up from about a quarter a year earlier, a concentration risk that turns a Korean tech wobble into a country-level index event.
Whipsaw like that, tech sold off on strong jobs data in early June and sold off again on weak jobs data in early July, isn't really a story about payrolls. It's a story about positioning that had gotten stretched enough that almost any incoming data could trigger a reset. Kevin Warsh, confirmed as Fed Chair and appearing at the ECB's Sintra forum on July 1st, gave markets almost nothing to work with directly, reaffirming the 2% inflation target and emphasizing the Fed's independence from the administration without hinting at his next move. His broader institutional agenda, reviewing Fed communications, shrinking balance sheet through deregulation rather than rate cuts, weighting productivity and AI's economic impact more heavily, is actual pivot variable underneath all of this rate-path noise. eToro's Lale Akoner frames the implication well - an era where abundant liquidity lifted everything gives way to one where fundamentals matter more, where active stock-picking outearns passive index exposure and where leadership broadens away from a handful of mega-cap names almost by design rather than accident.
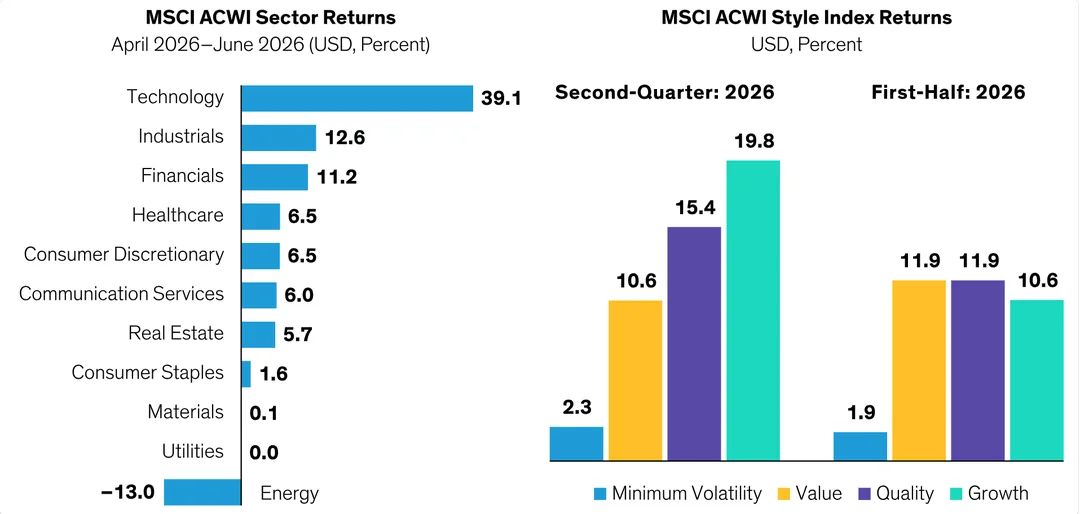
That quarter's own scoreboard makes positioning read concrete. Even through two separate selloffs, technology still posted the best second-quarter sector return of any group, up 39.1%, while growth as a style (+19.8%) actually beat value (+10.6%) over those same three months. Zoom out to the full first half, though, and value (+11.9%) edges back ahead of growth (+10.6%). That inside-out result, growth winning the quarter while value wins the half, is the fingerprint of a rotation that keeps reversing on itself rather than settling into a clean new trend.
Forbes' Dan Runkevicius, writing June 22nd, put the earliest precise numbers on this broadening: Russell 2000 up 20.1% year-to-date against the S&P 500's 9.6% as of June 18th, small caps beating large caps for the first time in years, with the Russell 1000 Value ETF up roughly 15% against the Growth ETF's roughly 3%, a twelve-point gap. Runkevicius calls the resulting posture a reflation trade, inflation and growth firming together, not so aggressively that growth chokes on its own inflation. Cyclicals are the tell - fixed cost bases mean earnings rise faster than revenue once nominal revenue starts climbing again, pure operating leverage. It's a bet, in his framing, that this cycle looks nothing like the dot-com unwind, because AI capex has already bled into the physical economy, chips, data centers, power equipment, grid upgrades, corporate spending broadly. That structural point is fair, but it rests on a stretched base: the Shiller cyclically-adjusted P/E sat at 41.66 in early July, within a few points of its dot-com-era peak, so however different the economic plumbing this time, the price being paid for it is not far off. Runkevicius's own closing warning is the sharpest single line in anything I read researching this piece - any real unwinding in AI capex spending, or even serious talk of capital discipline, could make this entire reflation trade collapse like a house of cards. I'd only sharpen where the risk already sits. It would not take a dramatic unwind to matter, merely a shift from spending on faith to spending with discipline. Chapter I showed the first signs of exactly that already surfacing: Blackstone stepping back from data-center positions and the market cheering Meta for renting out capacity rather than building more.
Institutions, Named and Quoted
Best institutional voice in this entire research project belongs to BlackRock, not because its numbers are flashier than anyone else's, but because they come with FactSet-dated precision most retail-facing commentary can't match. Carrie King, BlackRock's Global Co-Chief Investment Officer of Fundamental Equities, put a number on how much the AI trade has stretched valuations: aggregate S&P 500 free cash flow yield sat at 2.65% as of May 25th, lowest in 25 years, even as aggregate FCF margins remain near 15-year highs.
"AI momentum is undeniable, but even the most powerful mega forces are subject to hiccups. Diversification still matters."Carrie King, Global Co-CIO Fundamental Equities, BlackRock, Q3 2026 Equity Outlook
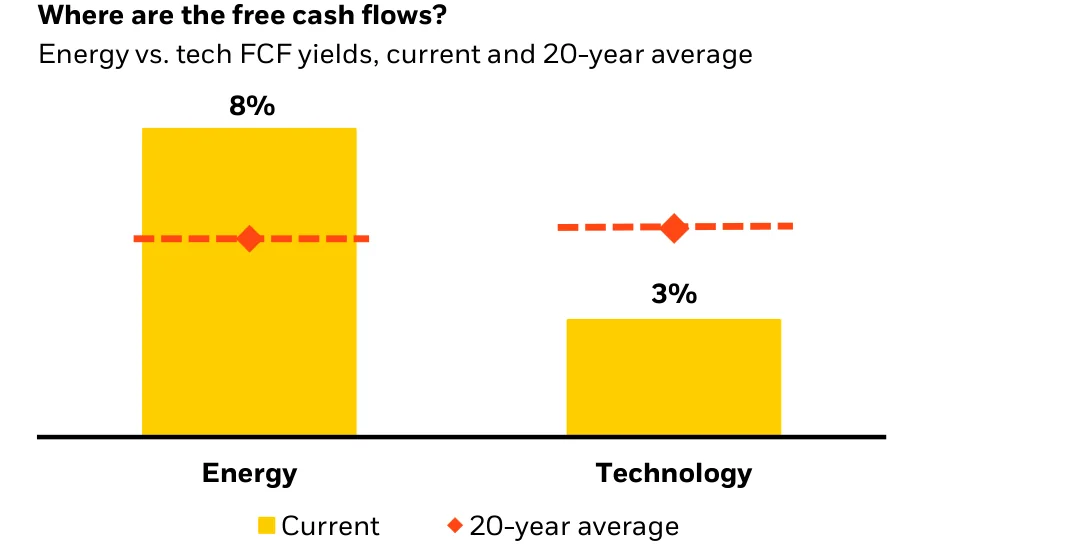
That's not a bearish call on AI. It's a valuation call on paying too much for otherwise-healthy cash flow. BlackRock's diversification picks lean on the same math. Global energy stocks carry an 8% FCF yield against technology's 3%, a gap tied to a genuinely tighter oil supply picture after Iran-conflict infrastructure damage and slow reservoir ramp-up, per Helen Jewell's section of the outlook. Materials and mining sit above a 7% yield, a four-point premium to the broader market against a 20-year historical average premium of just one point, driven by physical AI-infrastructure input demand and years of underinvestment. Healthcare, specifically pharma and health-equipment names, carries a 5% yield with low correlation to AI and trades at a 16% valuation discount to the market, versus a historical 20% premium over the past decade, an unusually cheap, genuinely AI-uncorrelated diversifier. Jeff Shen, BlackRock's Co-CIO of Systematic Active Equities, adds a detail worth sitting with: price momentum had its strongest start to a year in two decades through 2026, even as fundamental momentum, profitability and earnings-revision signals, struggled to gain traction. Positioning, in plainer language, has been driving returns more than fundamentals lately, exactly the kind of environment where a rotation like this one gets exaggerated in both directions.
South Korea earns its own line in BlackRock's outlook: earnings there are forecast to grow over 220% in 2026, largest of any region tracked, driven by a domestic corporate-governance reform program plus AI-linked memory and shipbuilding demand. Memory shortages are expected to persist at least two years, with demand running 20 to 30% above supply by BlackRock's own analysis, though the firm names its own falsification risk honestly - new fab capacity arriving just as demand cools could create a 2027-to-2028 oversupply, a specific, dateable risk marker that separates real analysis from cheerleading.
Palantir is the single clearest illustration in this study of what a rotation does to the most crowded name in a theme. It earns a short case study of its own.
Its vulnerability going in was price. At its November 2025 peak, Palantir traded near 247 times forward earnings, a multiple that leaves no margin for a change in mood, which is exactly what a rotation delivers. What followed was a textbook re-rating: the stock fell close to 50% from that peak, touched roughly $100 in June, a level last seen a year earlier, then round-tripped nearly twelve months of gains before steadying near $129 by July 4th.
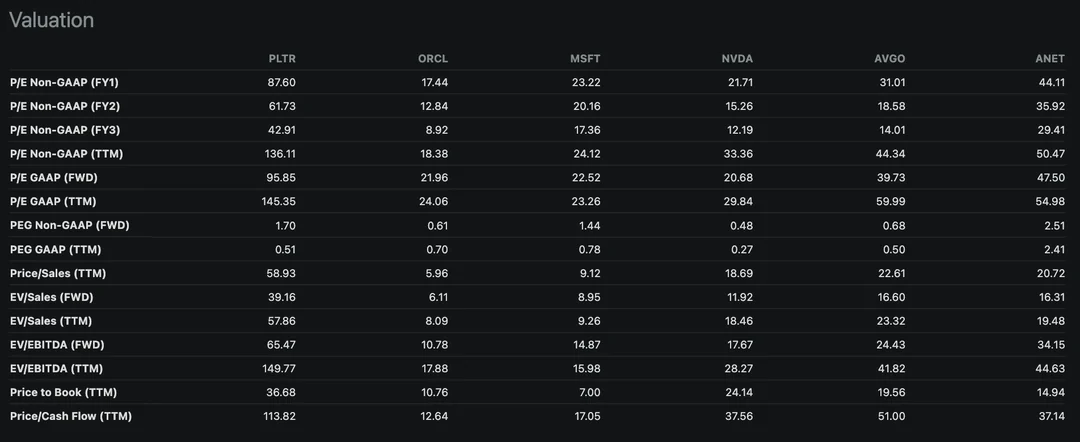
Underneath that valuation, the competitive picture is tightening too. Amazon Web Services has built its own Forward Deployed Engineers organization, following a similar move at Google, both encroaching directly on the implementation-services model Palantir built its moat around. Chief executive Alex Karp has been characteristically blunt about the industry dynamic.
"Tokenmaxxing hijacks your value orientation and decreases your institutional fortitude and intelligence."Alex Karp, CEO, Palantir Technologies
My takeaway from Palantir isn't a verdict on the stock. It's a warning about method. A name priced for perfection can round-trip a full year of gains in a single rotation and still screen as the most expensive stock on its own peer board, which makes single-stock timing inside a live rotation close to a coin flip. That is a big part of why this study leans on index and sector-level evidence rather than pretending to call individual entry points.
Three Ways This Resolves
Scenario framing matters more here than in most single-stock pieces, because the honest answer to whether this rotation is bullish or bearish is that it's both, depending which layer of the market you're standing on.
One bear case stands above the rest, worth taking seriously precisely because it refuses to dismiss the breadth data. Start from the weekly index scoreboard as of June 26th: Dow Jones Industrial Average at 51,876.1, up 7.9% year-to-date; S&P 500 at 7,354.0, up 7.4%; Nasdaq Composite at 25,297.6, up 8.8%. Magnificent Seven names, down 6.6% year-to-date as a group, are dragging the cap-weighted S&P lower even as equal-weight and small-cap measures sit at fresh highs. That bear thesis holds that AI capex is fundamentally cyclical spending: when hyperscalers eventually cut back, the hardware and chip names riding that spend will see multiple compression hit hard, ironically right around the point when the biggest spenders themselves, Alphabet, Microsoft, Amazon, Oracle, Meta, might start to bottom.
I take this case seriously because it isn't predicting a crash. It predicts the cap-weighted headline number grinding toward a 7,000 retest while its own equal-weight and small-cap constituents hold up, a much harder argument to dismiss than a generic bubble call. Weighing that against everything in chapters one through five, here's how I'd actually handicap where this goes over the next two to three quarters.
Signals That Would Change This Read
Anyone claiming certainty about how this resolves is selling something, so here's what I'm actually watching, in order of how quickly each one could prove me wrong.
Q3 and Q4 2026 earnings calls, first and most important. AllianceBernstein's own capex growth model has the rate decelerating from roughly 73% in 2026 to 41% in 2027, deceleration this thesis already assumes. What would break it is a hyperscaler guiding to an outright capex cut rather than merely slower growth, especially from Oracle or Amazon, already sitting past or right on their own cash-flow crossover points. Deceleration is priced. A cut isn't.
Epoch AI's crossover timeline, second. Alphabet's modeled crossover sits at Q1 2027, Meta's at Q3 2027, Microsoft's at Q3 2028. If Alphabet's actual free cash flow print for that quarter comes in meaningfully worse than the negative-to-flat range currently guided, or if Meta's crossover arrives earlier than modeled, that's a concrete, dateable signal the capex-versus-cash-flow gap is widening faster than this diffusion thesis assumes.
Sector Health Score, third and the easiest to track in real time. Trading Tools' own dashboard sits at 76 out of 100 as of early July, comfortably inside its Healthy band. A sustained drop below 55, into Fragile territory on the firm's own scoring bands, over more than a single week would be the clearest real-time signal that breadth is narrowing again rather than continuing to broaden.
Kevin Warsh's actual policy moves, fourth. Sintra gave the market almost nothing concrete. Actual FOMC decisions on the balance sheet, plus any explicit hawkish or dovish tilt beyond the studied neutrality he's shown so far, will matter more than anything he's said in public to date.
Memory chip supply and demand, fifth and most technical item on this list. BlackRock's own analysis has demand running 20 to 30% above supply currently, with shortages persisting at least two years. Micron and Marvell's spectacular 2026 gains depend heavily on that imbalance holding. New fab capacity landing right as AI training demand growth slows, the 2027-to-2028 oversupply risk BlackRock names honestly in its own outlook, would hit those specific names hardest and fastest of anything on this list.
Falsification condition, stated plainly, because a piece like this earns trust by naming what would prove it wrong rather than hedging every sentence into meaninglessness. I'd abandon the diffusion thesis if two or more of the five hyperscalers confirm free cash flow materially worse than Epoch's own crossover timeline at their next two earnings reports. That specific, checkable outcome, not vague sentiment shifts and not another single bad trading session in semiconductors, is what would tell me this stopped being a rotation and became something closer to the bear case.
Rotation headlines will keep writing themselves every time a health insurer beats a chipmaker for a week. Ignore the headline and read the constituents instead, because that's where this actually lives: not tech losing, but AI capital finding new addresses inside sectors nobody thought to look.
Ian Andy, Macro Desk, Bellwether Research, July 5, 2026