Situation Report
Ten days ago the S&P 500 closed at a record. This week the IMF warned that an AI correction could have global consequences and September's inflation print came in hot. By Thursday, credit default swaps on CoreWeave, the largest independent AI cloud, priced a nearly 63% chance of default within five years. That same day TSMC, which makes almost every advanced AI chip on earth, told investors that demand still exceeds what it can supply.
One week produced a clean demand signal for the AI trade and its loudest credit warning so far, each from a company at the centre of it. Both can be true at once. Together they point to a narrower question than whether AI is real – which part of the boom is priced on evidence and which part on money that has not yet been earned.
My answer is that this is a bubble, though not where most of the argument is aimed. Price-to-earnings multiples look nothing like 1999's. Nvidia trades at 17 times next year's profit, below the index it leads. This boom's excess is in the amount of capital being committed and in the debt that has started to pay for it. Since that same spending manufactures a large slice of today's earnings, the sensible-looking multiples protect investors less than they appear to. And the first cracks are showing up in bonds before stocks.
Put through four tests in order (price, earnings, quantity, credit), this boom scrapes through one and fails three, each failure more serious than the last.
Crowded Warnings, Record Highs
Few booms have had their ending forecast this loudly while still in progress. Michael Burry, whose bet against mortgage bonds became The Big Short, spent September attacking circular deals that bind chipmakers to their customers, then closed the month with an essay arguing that today's language models took a costly wrong turn. Ray Dalio told the Forbes Global CEO Conference in Singapore last week that AI is a classic bubble approaching its bursting point. Jeremy Grantham and Paul Tudor Jones have said versions of the same thing. Capital Economics, whose senior markets economist James Reilly describes a late-stage bubble, pencils in 8,250 for the S&P 500 at the end of this year and 6,500 a year later.
Official institutions have joined in. On August 17th five economists published an ECB blog concluding that a correction in AI-driven valuations is likely, even if today's enthusiasm turns out to be rational. On Tuesday the IMF's Global Financial Stability Report listed an AI market correction among the plausible near-term triggers of financial stress. Athanasios Vamvakidis, a deputy director in its capital markets department, put the problem in five words – "resilience is not necessarily safety."
On the other side are people nobody would call permabulls. Marty Fridson, writing for Reuters in September, put Howard Marks, Jeremy Siegel and Ed Yardeni in the camp arguing that today is not 1999. His own figures back them on price, as Chapter II shows.
Positioning tells you more than any op-ed. Bank of America's October fund manager survey, published on Tuesday, ranks an AI bubble bursting as the second-largest tail risk in markets, behind only a disorderly rise in bond yields. In the same survey a net 37% of managers are overweight technology, up from 30% a month earlier. Global semiconductors are named the most crowded trade. As a group, the managers who fear the bubble own more of it than they did in September.
That combination is less contradictory than it sounds. On December 5th 1996 Alan Greenspan warned of "irrational exuberance". He was right about the diagnosis. Over the following twelve months the S&P 500 rose more than 40%. It did not peak until the spring of 2000, almost 110% higher than the day he spoke. A correct call delivered more than three years early cost the people who acted on it more than most wrong calls do. Managers who fear a bubble and still own it have learned that lesson.
This study cannot date a top. I don't try to. It can separate what is expensive in this boom from what is fragile, two things that are easy to confuse.
Arguments about bubbles go in circles because each side uses a different definition. Charles Kindleberger described the sequence that most manias follow – a real technological displacement, a boom fed by credit, euphoria, distress and finally revulsion. Hyman Minsky added the part that matters for timing. Booms become dangerous when the people financing them shift from borrowers who can repay out of cash flow to borrowers who need asset prices to keep rising. Neither man thought a bubble required a fake technology. Railways were real. So was the internet.
I turn that into four measurable tests. A boom that fails one of them badly deserves attention. In 1999 the market failed all four.
Are valuations extreme relative to the profits companies actually earn?
Are those profits themselves a product of the boom, so that they shrink when it slows?
Is capital being committed faster than paying demand can absorb it?
Is the boom now financed by debt whose repayment depends on the boom continuing?
Price comes first, because that is where the bears are weakest.
Test One – Price
On the measure most people reach for first, this market does not look like a mania. FactSet put the S&P 500 at 19.0 times forward earnings at the end of September, a touch below its own five-year average of 19.8 and level with its ten-year average of 19.1. In March 2000 the Nasdaq-100 traded at roughly 60 times. Those two readings are not in the same league.
Sector by sector the gap holds. Fridson's Reuters column put information technology at 22.5 times forward earnings in mid-September, less than half the 54.8 it reached in early 2000. He also pointed out that technology now makes up 38% of the S&P 500, twice its long-run share. It has traded above the index multiple in 73% of quarters since 1990. Weighted to its historical sector mix, the S&P 500 would trade on a multiple seven-tenths of a point lower. Some of what looks expensive is composition.
Nvidia finished its record run in early October worth some $5.75 trillion. Consensus compiled by FactSet puts it at 17 times next year's earnings, a cheaper multiple than the S&P 500 it dominates. Cisco, the bellwether of 2000, peaked above $500 billion at well over 100 times earnings on a net margin of 14%. Nvidia keeps more than half of every revenue dollar as net profit. Whatever else this is, it is no Cisco.
Even the Federal Reserve's markets desk has noticed. Minutes of the September policy meeting, released on October 7th, record its manager's observation.
"The rise in equity prices this year was entirely attributable to strong actual and expected corporate earnings, while price-to-earnings multiples had declined."
Manager of the System Open Market Account, FOMC minutes, September 15–16, 2026In 1999 prices outran profits. In 2026, on the central bank's own reading, profits outran prices. If I stopped there, I would have no case. A price-to-earnings ratio has two parts, though. Only one of them is being argued about.
Robert Shiller's cyclically adjusted P/E divides price by the average of the past ten years of inflation-adjusted earnings instead of next year's forecast. It stood at 41 in September, against a long-run average of 17. It had been above 40 only once before, at the dot-com peak, when it reached 44 in December 1999.
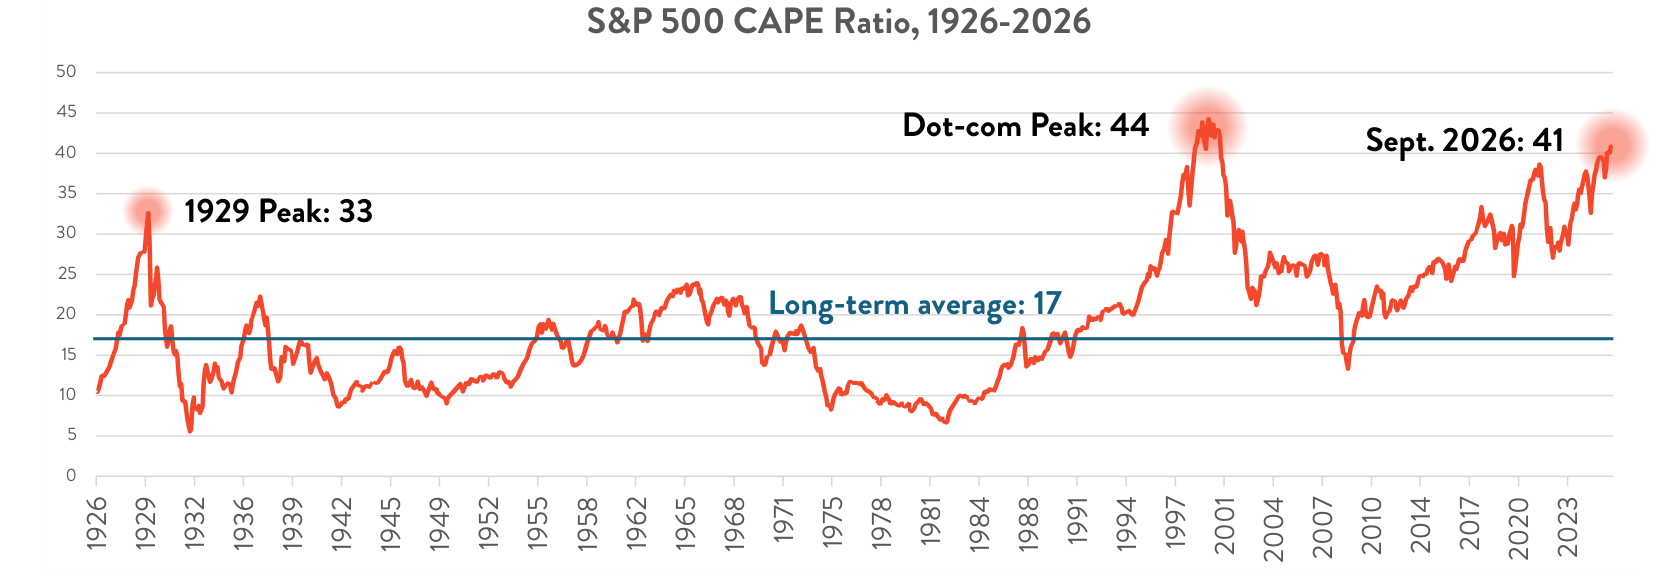
Both readings are correct, because they measure different things. A forward multiple of 19 says investors are paying a normal price for next year's profits. A CAPE of 41 says those profits sit far above anything this market has earned on average over the past decade. Divide one by the other and you get a rough gauge of how stretched earnings themselves are – about 2.2 today, against roughly 1.7 at the dot-com peak. By that yardstick earnings are more stretched now than at the 2000 top, while the multiple is much less stretched. I find that ratio more useful than either number alone, because it separates what investors pay from what they are paying for.
That moves the real question out of the multiple and into earnings. Are today's profits a new plateau or a cyclical peak? Chapter III takes that up. Valuation also has to be read against interest rates. Subtracting the 10-year Treasury yield from the stock market's forward earnings yield gives a crude measure of how much extra return investors expect for owning equities instead of government bonds.
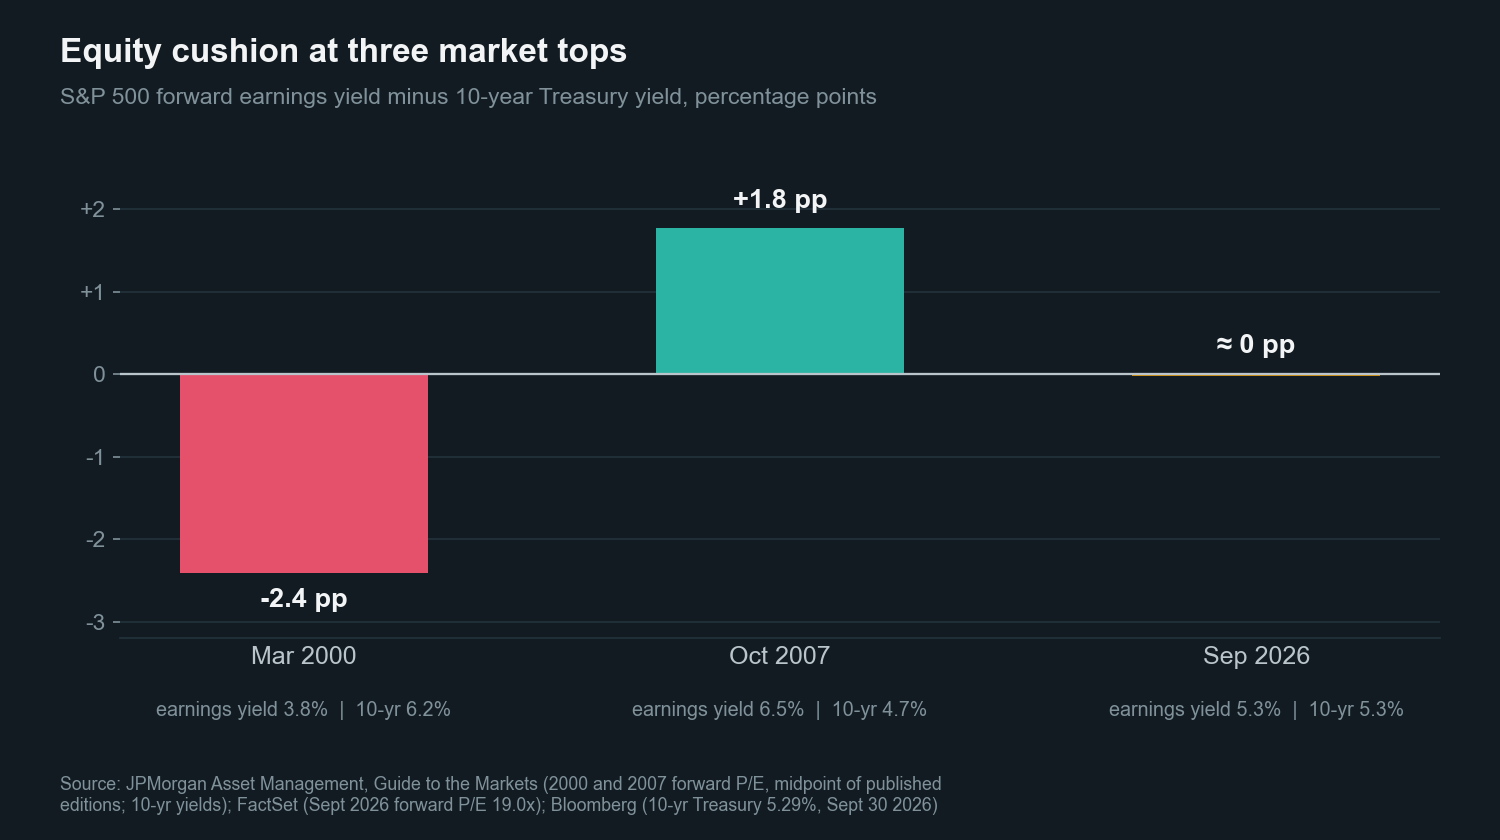
Rob Edel, chief economist at Nicola Wealth, made the same point in plain words on Thursday, saying investors "are not currently being paid extra to own stocks rather than government bonds." With the 10-year yield at 5.29% at September's close, its highest since 2002, an earnings yield near 5.3% buys nothing extra for the risk.
Test 1 verdict: pass on multiples, fail on cushion. Valuations are nowhere near 2000. Even so, the market has priced away its margin for error just as long-term rates climb. On price alone, this boom is only moderately expensive.
Test Two – Earnings
Profits in this cycle are partly made by the spending they are supposed to justify. That follows from basic accounting.
Michał Kalecki worked out this mechanism in the 1930s; Jerome Levy reached the same identity independently. Across a whole economy, one company's investment is another company's revenue, so when businesses collectively invest more, aggregate profits rise almost automatically. When Alphabet, Amazon, Meta and Microsoft order servers, Nvidia, TSMC, Micron and Broadcom book revenue in the quarter the hardware ships. Buyers spread the same cost across five or six years of depreciation. Supplier profit arrives up front and buyer cost arrives slowly. While spending keeps rising, the sum of the two flatters reported profit.
By Goldman Sachs's estimate, the $800 billion or so the largest technology companies will spend on data centres this year accounts for almost half of expected growth in S&P 500 earnings. Analysts expect third-quarter earnings to rise 29%, after two quarters of growth near 25%. Without the build-out, index earnings would be growing at the pace of an ordinary expansion.
A forward multiple of 19, the comfort in Test One, is reasonable only if the earnings underneath it persist. If capital spending merely stops growing, never mind falls, a large slice of index earnings growth disappears without any company failing.
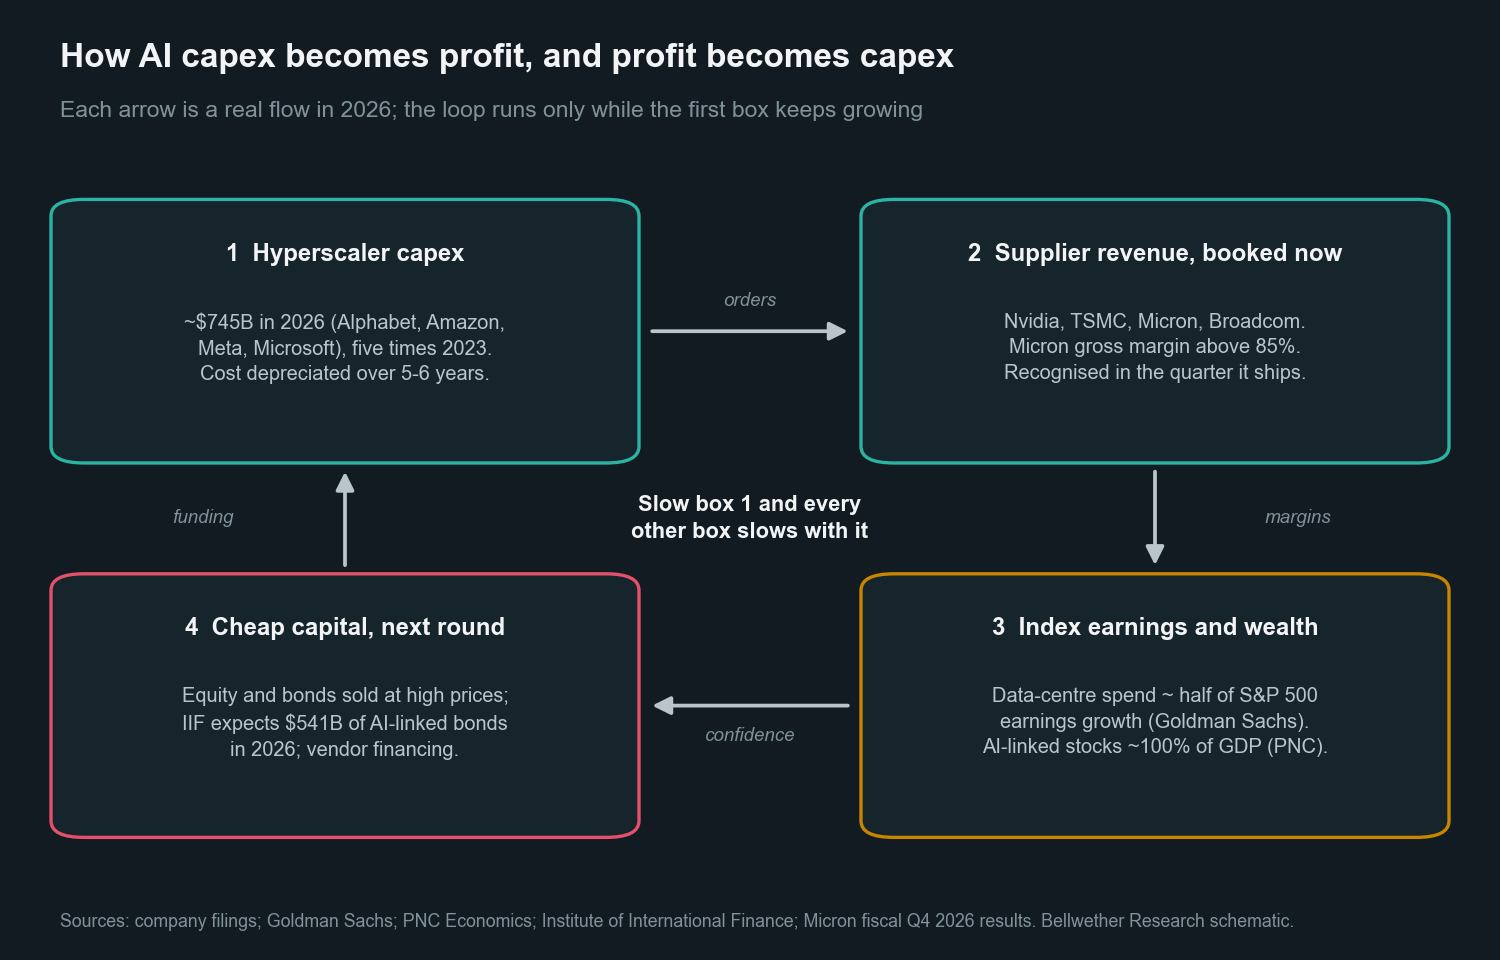
Memory chips show what happens to profit built this way. Micron reported fiscal fourth-quarter revenue of about $54 billion on September 30th with a gross margin above 85%, numbers that would have read like a misprint for a commodity memory maker three years ago. Its shares are up some 280% this year and the company is worth $1.2 trillion. Memory is also the most cyclical corner of the semiconductor industry. Its last two profit peaks, in 2018 and 2022, were each followed within about a year by a collapse in prices, because shortage margins are what pull new capacity into the market. A low price-to-earnings ratio at peak margins is the oldest trap in cyclical investing. Today it describes several of the stocks driving the index.
A second source of earnings comes straight from the valuations being debated. According to the Financial Times, $160 billion of the $285 billion of second-quarter profit reported by Alphabet, Amazon, Meta, Microsoft and Nvidia came from marking up stakes in other AI companies, chiefly Anthropic and SpaceX. Alphabet alone booked $98 billion of investment gains in the quarter. Those gains exist because private AI valuations rose. If those valuations fall, the same accounting runs in reverse. Part of reported profit turns into reported loss just when confidence is weakest.
Some of the revenue is also circular. Bloomberg reported in August that OpenAI accounts for most of Microsoft's AI sales, 70% or more on one Wells Fargo estimate. Ara Kharazian, chief economist at Ramp, which tracks corporate card and bill spending, found that 80% of OpenAI's and Anthropic's enterprise revenue comes from 1% of their customers, a group tilted heavily toward technology companies. Nvidia, meanwhile, invests in the labs and cloud companies that buy its chips. None of these arrangements is improper in itself. Together they make it very hard to tell how much AI revenue originates with end customers paying out of their own profits, which is the only kind that can repay a trillion dollars of capital. From the outside I cannot separate these flows; the filings do not break them out.
Depreciation adds a quieter distortion. Hyperscalers write their servers off over five to six years. Nvidia now ships a new architecture every year. One analysis of a GPU cohort booked for 5.5 years of service found it trending toward 3.7 years of real use. Michael Burry estimated last November that the gap between book and economic lives would overstate the four largest spenders' earnings by more than $200 billion through 2028. I can't verify his figure. Whatever the exact number, the accounting flatters current profits.
A large part of the E in P/E is the boom itself, booked as revenue by suppliers, marked up as gains by investors and stretched by generous depreciation schedules.
Test 2 verdict: fail. Roughly half of index earnings growth depends on spending continuing to rise; a further layer depends on private valuations doing the same. To Chapter II's question, plateau or peak, the evidence points to a peak, one that spending can prolong only as long as it keeps growing. That makes the reasonable multiple in Test One conditional on what Tests Three and Four find.
Test Three – Quantity
On quantity there is no ambiguity at all. Stijn Van Nieuwerburgh of Columbia Business School, presenting at the Brookings Papers on Economic Activity conference in September, estimates that the United States will invest $10.3 trillion in AI infrastructure between 2025 and 2032, roughly 3.6% of GDP every year. Measured that way, the build-out outweighs each of the great American infrastructure booms in his comparison, railroads included.
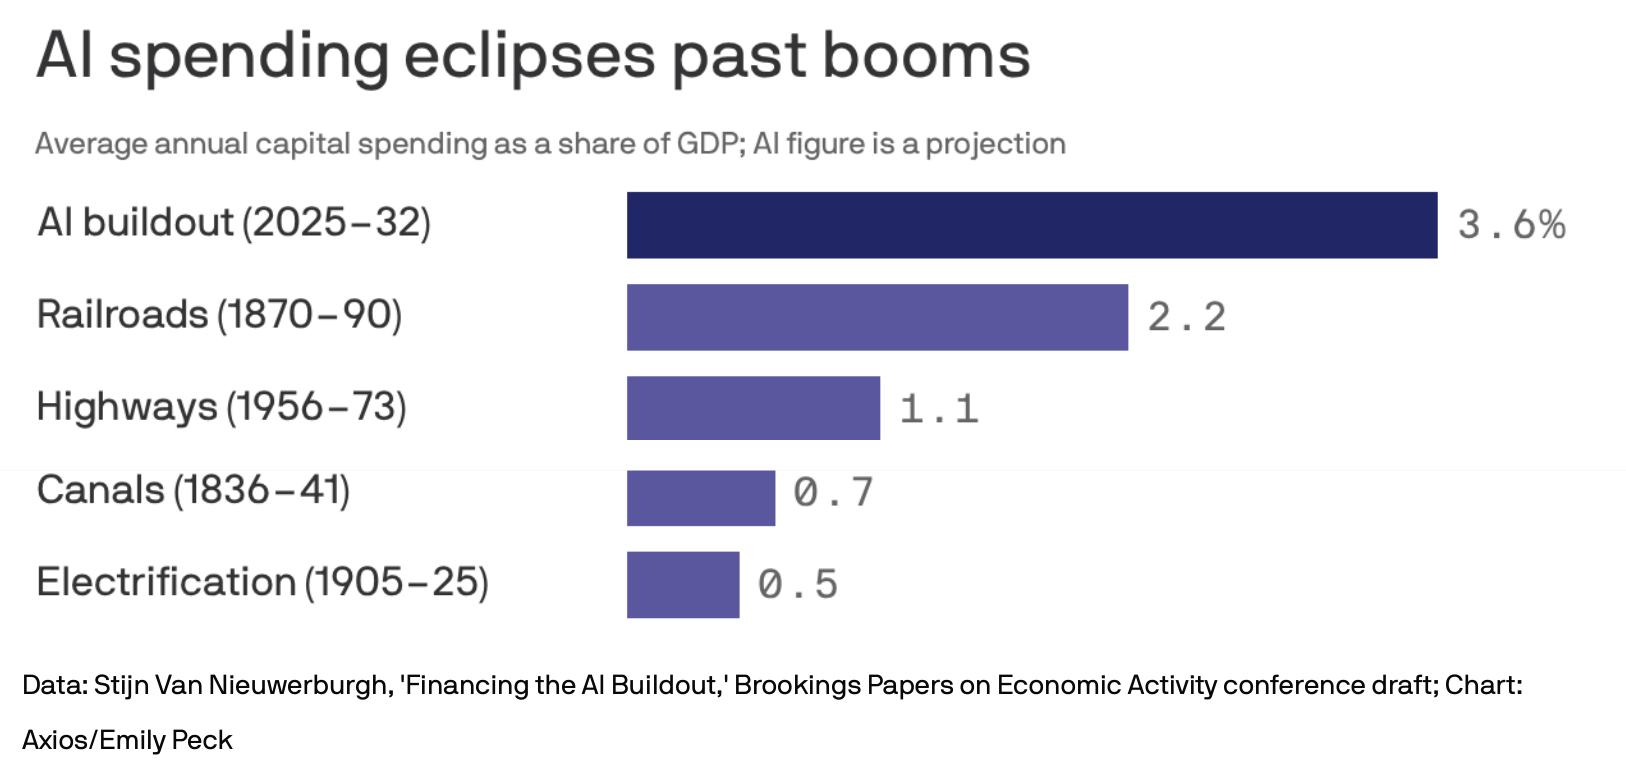
Alphabet, Amazon, Meta and Microsoft are on course to spend about $745 billion on capital expenditure in 2026, five times their 2023 outlay and double last year's. Goldman Sachs expects global AI investment to pass $1 trillion this year. UBS lifted its 2027 estimate by $200 billion at the start of October, to $1.4 trillion.
Revenue is growing at a speed with few precedents and still runs an order of magnitude below the spending. OpenAI told investors its annualised revenue was close to $50 billion at the end of September, according to the Financial Times, some $20 billion below a figure that had circulated only weeks earlier. Anthropic told investors its run rate had passed $65 billion by the end of July. Together that is close to $115 billion a year against some $1 trillion a year of capital. About twelve cents of model-maker revenue for every dollar spent.
Model-lab revenue is not the only return on that capital. Hyperscalers also earn AI-related revenue inside their cloud and advertising businesses, while some of the build-out simply defends franchises they already own. But much of the cloud revenue labelled AI comes from the same two labs, as Chapter III showed, so I leave it out to avoid counting it twice.
Definitions flatter these figures as well. Reuters Breakingviews showed in March how Anthropic calculates its run rate: the last 28 days of usage revenue multiplied by 13, plus monthly subscriptions multiplied by 12. Investors in 1999 paid for page views; now they pay for annualised run rates. Neither is cash.
David Cahn of Sequoia Capital has kept score for three years. In September 2023 he asked how the industry would earn the $200 billion of revenue its chip purchases implied. By June 2024 his figure was $600 billion. In July this year he estimated that $1.5 trillion of end-user revenue would be needed just to cover 2026's capital spending. Each time revenue grew, the revenue required grew faster, which is how a quantity bubble behaves.
More conservative arithmetic, which spreads cost over each machine's useful life, narrows the gap without closing it. Goldman Sachs estimates the hyperscalers need about $300 billion of annual AI revenue simply to break even on the build. Jared Bernstein and Ryan Cummings of the Stanford Institute for Economic Policy Research put the shortfall between hyperscaler spending and AI revenue since 2024 at close to $1 trillion. By their arithmetic, AI revenue would need to triple or quadruple next year, then keep compounding at a very fast pace for a decade, for the investment to pay off. Their conclusion leaves room for two endings, a pop or a slow deflation. My base case is the second.
"If our assessment is correct, investor patience is likely to run out, and, depending on the pace at which they rush for the exit, the bubble will either pop or start to deflate."
Jared Bernstein and Ryan Cummings, Stanford Institute for Economic Policy Research, September 2026Here the bulls are strongest. Every price signal in computing still says shortage. TSMC said on Thursday that AI demand exceeds its capacity to supply, after third-quarter revenue rose some 41% to $46.7 billion. Its guidance for the fourth quarter came in higher still. One-year rental contracts for Nvidia's H100 rose from $1.70 to $2.35 an hour between last October and March, according to SemiAnalysis. Micron's high-bandwidth memory is sold out for 2026. In 2001, by contrast, bandwidth prices were falling by more than half a year as unused fibre flooded the market. Prices do not rise in a glut.
I don't dispute any of it. It still does not settle Test Three. Shortage pricing is normal while a capital cycle is building, because shortages are what summon new capacity. Memory has followed exactly that path twice in eight years. Capacity also arrives with a lag that makes today's tightness a poor guide to 2028. Nvidia disclosed $279 billion of supply and capacity commitments in July, more than double the figure three months earlier. TSMC expects its two-nanometre capacity to more than double next year. Only about half of the AI computing capacity scheduled for the next two years is expected to arrive on time, which prolongs today's shortage while lengthening a queue of commitments behind it. Scarcity now and surplus later belong to the same cycle. My reading is that the shortage buys the bulls a year or two at most.
Test 3 verdict: fail, on today's numbers. Spending runs nearly ten times ahead of the revenue it is meant to earn; required revenue keeps rising faster than actual revenue. Price signals pointing the other way are normal at this stage of a capital cycle.
Test Four – Credit
Credit tells you who is paying for the build. This year the answer changed.
Until last year the build-out was paid for mostly out of operating cash at four of the world's most profitable companies. In Minsky's terms that was hedge finance, spending that cash flow could cover. On Bloomberg's figures, combined free cash flow at Alphabet, Amazon, Meta and Microsoft peaked in 2024 and has been falling since, while their capital spending more than doubled. Alphabet reported negative free cash flow this summer for the first time in its two decades as a public company. On analysts' estimates the four turn negative together around the start of 2027.
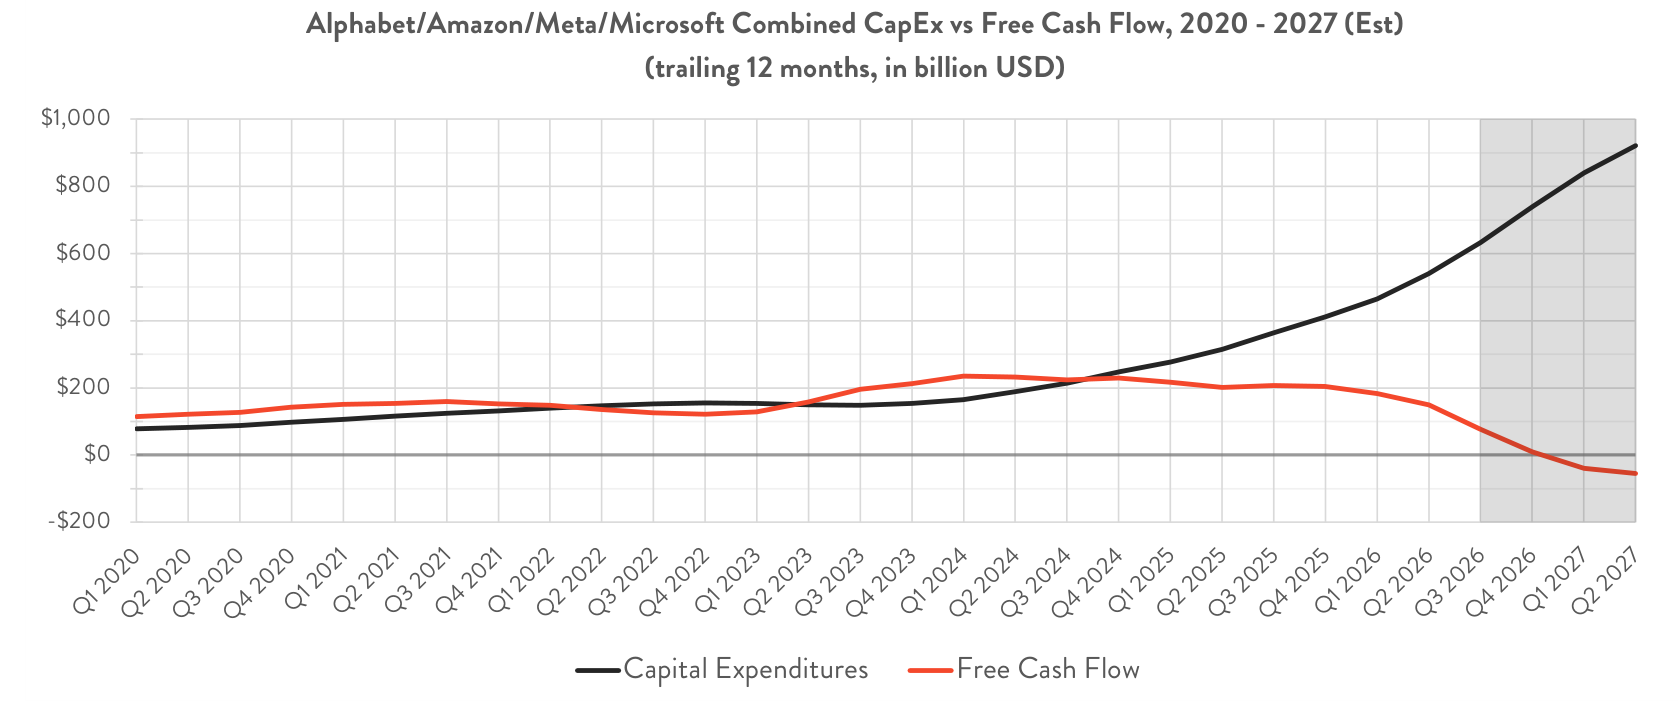
Debt is filling that gap. According to the Institute of International Finance, AI-linked corporate bond issuance should reach $541 billion this year, up from $90 billion three years ago. On Tuesday the IMF said that hyperscalers now account for 10% of global investment-grade bond issuance, up from under 1% in 2024. Alphabet also sold $85 billion of new shares in May. When companies this rich in cash start issuing paper at this pace, the boom has stopped funding itself. If you own an investment-grade bond fund, you are already lending to this build-out.
Bond issuance is only the visible part. Most of the obligations are off balance sheet, in leases and purchase commitments that accounting rules do not count as debt but that behave like it. Leases are ordinary in property; what is unusual here is their size relative to the revenue they are meant to support. Future data-centre lease commitments at Alphabet, Amazon, Meta, Microsoft and Oracle reached about $1.1 trillion at the end of June, more than fourteen times their level when ChatGPT launched. In August the Wall Street Journal tallied at least $3.1 trillion of off-balance-sheet commitments across nine of the largest AI companies. Its report was blunt about why that matters.
"Whether or not the revenues ever arrive, purchase commitments and signed leases can't be canceled, for the most part."
Wall Street Journal, August 16th 2026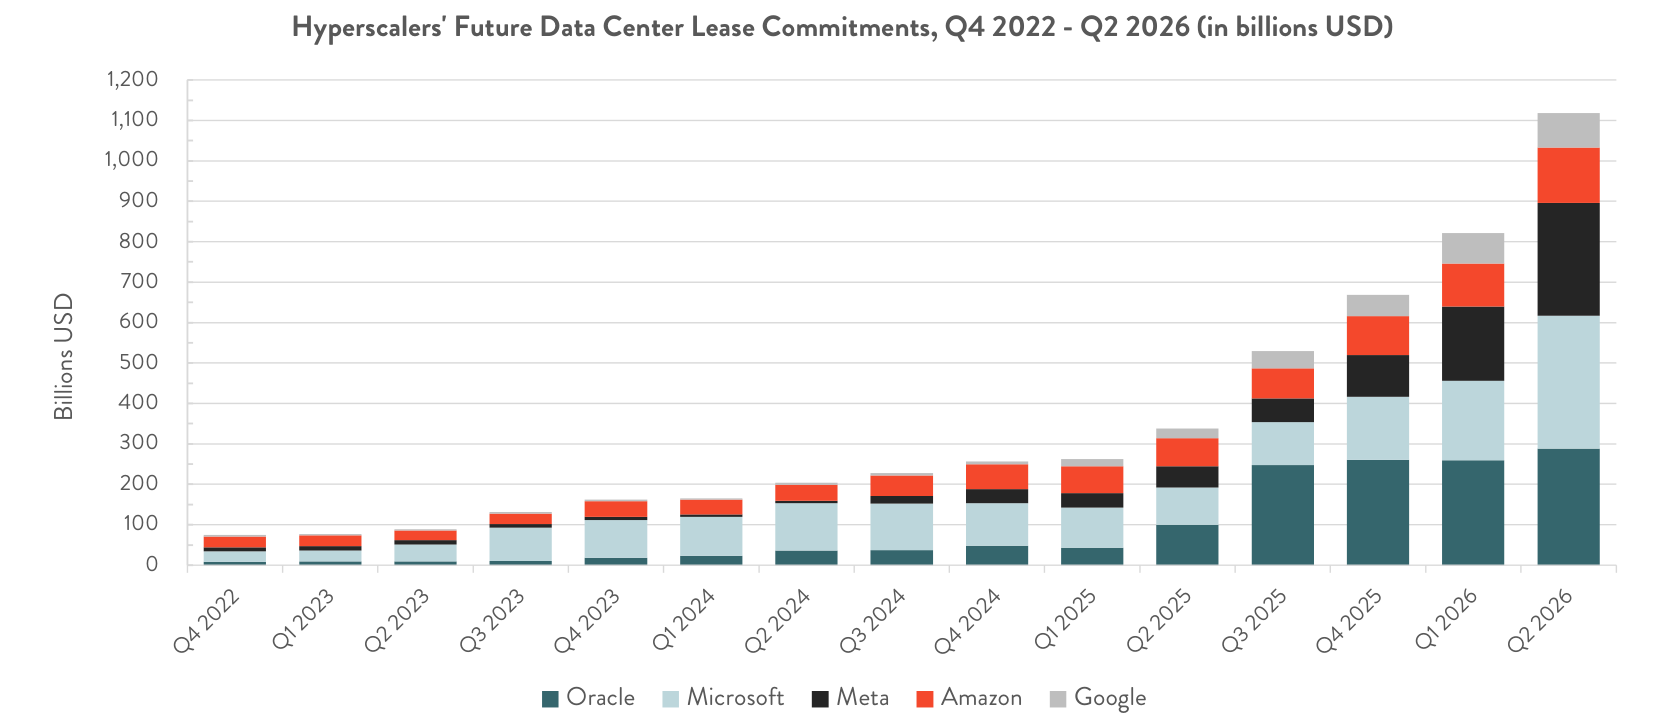
Van Nieuwerburgh's Brookings paper traces where the risk goes once it leaves the balance sheet – into joint ventures, private credit funds and securitised bonds. His case study is Meta's Hyperion campus in Louisiana, financed through a vehicle with roughly 90% leverage at the project level behind a tenant whose own market leverage is about 4%. Meta's lease payments and the guarantee it gave the vehicle's lenders both stay outside its reported debt today. Describing those two obligations in June, he wrote:
"Both cannot simultaneously remain off the balance sheet: with certainty, one of the two must eventually appear."
Stijn Van Nieuwerburgh, Columbia Business School, June 2026Nvidia now acts as a lender as well as a chipmaker. Its July quarterly filing disclosed $511 billion of forward purchase commitments and guarantees, against $63 billion of cash. In August it guaranteed $105 billion of OpenAI's lease commitments at a data centre in Ohio. It has also agreed to backstop up to a quarter of certain deals in a $500 billion bank financing programme for AI computing contracts. In the Economist's phrase, Nvidia has become "the central bank of AI". In 2000 that role belonged to Lucent and Nortel, whose vendor financing kept customers buying until the customers could no longer pay.
Weaker links are already being tested. CoreWeave, which borrows against Nvidia chips to rent computing power to the model labs, has about $50 billion of debt. On Wednesday its shares fell 15% to $65.78. By Thursday its 2031 bonds yielded more than 16% and its credit default swaps traded around 1,000 basis points, implying a nearly 63% chance of default within five years, up from some 30% a year earlier.
"The market is waking up to the fact that AI demand and a profitable business model are two very different things."
Axel Rudolph, Chief Technical Analyst, IG Group, October 15th 2026Jensen Huang tried to calm things from Stockholm on Thursday, insisting that CoreWeave's "cost of capital is actually decreasing". Nvidia is CoreWeave's supplier, one of its investors and, through a $6.3 billion agreement to buy unused capacity, its customer of last resort. When the head of a company's largest supplier has to make that argument in public, bond investors have already reached the opposite conclusion.
Oracle is the larger version of the same exposure. It has some $120 billion of long-term debt and $260 billion of lease commitments, much of it tied to OpenAI's $300 billion pledge to rent its capacity. Its credit rating is one notch above junk; in July the cost of insuring its debt reached a near 18-year high. Its own annual report names the risk with unusual candour, warning that Oracle could be "locked into multi-year commitments for excess data center space and related capital expenditures, as well as associated financings, without receiving corresponding revenue."
Broader credit shows the same pattern from the bottom up. Spreads on CCC-rated bonds, the market's weakest tier, widened from 8.6 to more than 10 percentage points during September, their widest since March 2023's regional banking scare, while investment-grade spreads barely moved. Weakest borrowers first is how credit cycles usually turn. Nor does the strain stay with the borrowers. In its September minutes the Fed names AI borrowing as a cause of higher long-term rates for everyone, citing "competition for capital from heavy private debt issuance to finance the development of artificial intelligence (AI) infrastructure" as one reason term premiums and Treasury yields rose. Chair Kevin Warsh has publicly listed AI borrowing among the forces lifting long-term yields.
Behind the public bonds are private credit funds and life insurers, two of the most eager lenders to data centres. Morgan Stanley has projected that private credit could hold as much as $800 billion of data-centre debt by 2028. US state insurance regulators have opened an inquiry into whether the ratings on insurers' data-centre loans hold up. Stefan Hepp of Chicago Booth traced in August where permanent losses would settle in a bust – first in private credit funds and dedicated AI-infrastructure vehicles, then with the pension plans and endowments invested in them.
Test 4 verdict: fail, and worsening. Funding has moved from cash to credit, from balance sheets to side vehicles, and from the strongest borrowers to the weakest. Credit markets already price distress at the edges; ten days ago equity indices were at records. In 1999 and again in 2007, stress showed up in credit months before stocks peaked.
Four tests, then... one mixed, three failed. In Chapter I's terms, this boom is only moderately expensive and highly fragile. Reasonable multiples sit on top of earnings, spending and debt that all depend on the build continuing.
Economy Wrapped Around a Trade
If AI were a sector story, those failures would cost only the shareholders of the companies involved. It is now a macroeconomic one. PNC's economists estimate that the market value of publicly traded AI-linked companies reached 100% of US GDP this year, up from 35% in the quarter ChatGPT launched. They also estimate that AI-related capital spending and the wealth effect from AI stocks are together adding about 0.65 percentage points to annual real GDP growth.
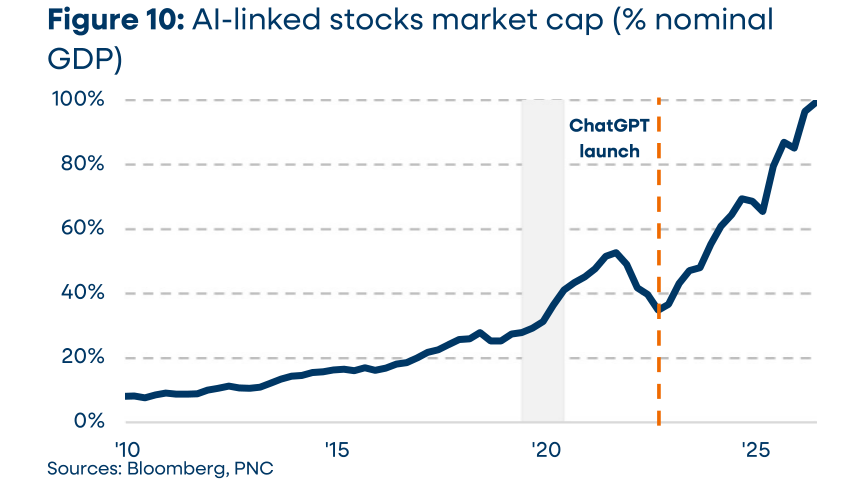
Arend Kapteyn, chief economist at UBS, went further on October 1st. By his reckoning AI investment and the AI wealth effect now account for 80% or more of US economic growth, while non-AI investment is "running at zero".
"It just looks like AI is neutralizing everything, at least on an aggregate level."
Arend Kapteyn, Chief Economist, UBS, October 1st 2026Households are spending the gains. PNC finds that consumer spending has outpaced income since mid-2024 without savings running down. It traces the difference to people monetising stock-market wealth, with customers in or near retirement drawing increasing sums from brokerage accounts. On its estimates the AI wealth effect added about a quarter of a point to growth in this year's first half and will add closer to eight-tenths in the third quarter. Run in reverse, the same mechanism would hit the economy twice at once, through slower investment and weaker consumption.
AI spending is also feeding the inflation the Fed is trying to fight. Staff analysis in September's FOMC minutes lists "an increase in technology-related consumer goods prices associated with the AI buildout" among the reasons inflation rose, alongside tariffs and energy. Memory chips that cost more for data centres cost more for phones and laptops too. Power bills on the largest US grid have climbed with data-centre demand. On September 16th the Fed raised rates for the first time since 2023, to 3.75–4.00%. Chair Warsh said the move had "removed a dose of accommodation". On Wednesday September's consumer prices came in at 3.7% year on year, above forecasts; the S&P 500 fell 1.1%.
This is where it gets awkward for the Fed. PNC tested how stocks react to hawkish policy surprises using the San Francisco Fed's event-study database. Across most of the past fifteen years, AI-linked stocks fell about as much as everything else when the Fed surprised hawkishly. Between 2021 and 2024 they fell more. Since 2025 they have risen.
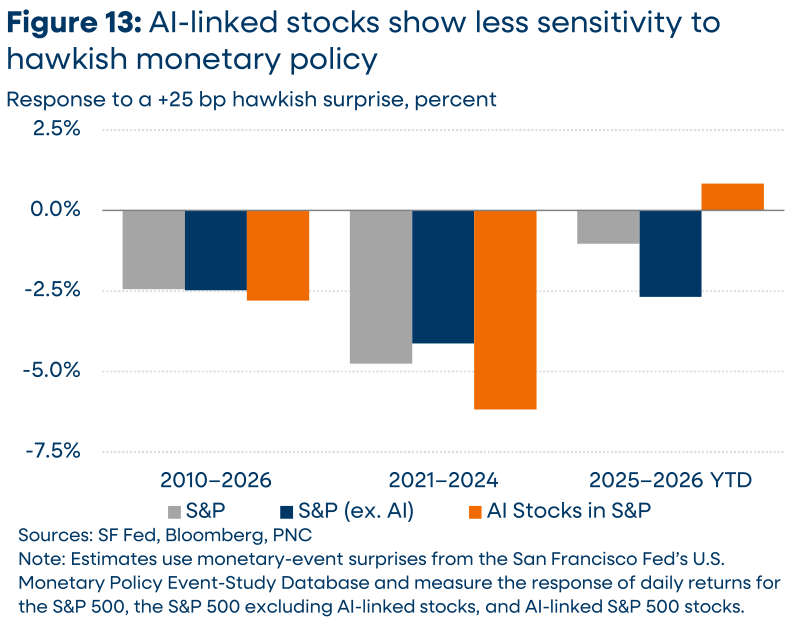
PNC's economists say as much, warning that if the economy does not respond, "the central bank may keep raising the fed funds rate until something 'breaks.'" Chapter V suggests where that something is likeliest to be... among leveraged borrowers at the edge of the build. After Wednesday's inflation report, futures priced even odds of another increase on October 28th.
Bond markets have been running ahead of the Fed. Ten-year Treasury yields rose nearly a full percentage point in the third quarter, their largest quarterly increase since 1994, to close September at 5.29%. Reuters noted on September 25th that global borrowing costs had reached their highest since the 2007–08 crisis, rattled in part by "a torrent of AI debt", while world stock indexes stood less than 2% from their records. Bloomberg strategist Simon White has pointed out that when the 10-year moves much above 5.25%, stocks and bonds have almost always moved in the same direction, which removes a hedge that balanced portfolios rely on. If you hold such a portfolio, that matters more to you than any valuation ratio in this study.
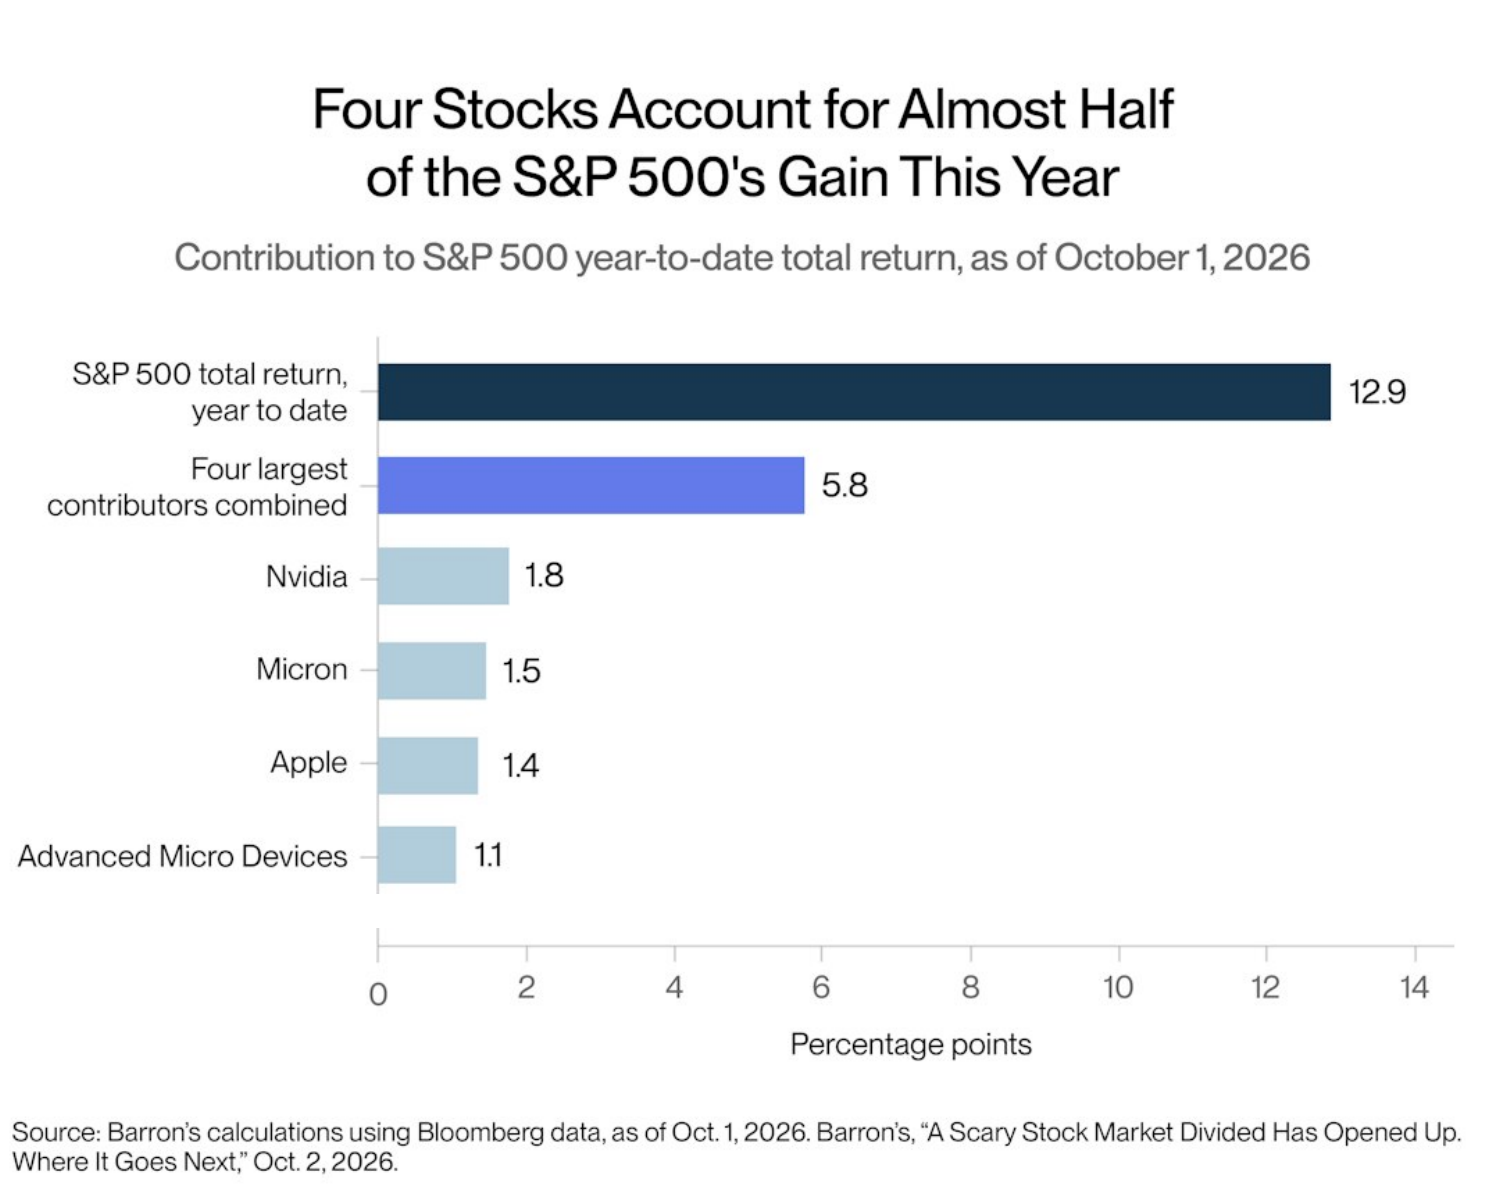
In the stock market, dependence on AI shows up as concentration. A correction is already under way beneath the index. In September the S&P 500 slipped 0.3% while its equal-weighted version fell 4.8%. Only technology and communication services rose. At quarter-end, according to Nasdaq's market intelligence desk, 83% of S&P 500 members were more than 10% below their 52-week highs and 42% more than 20% below, while the index itself was 2% from its high. If you own an S&P 500 index fund, almost half of your return this year came from four companies.
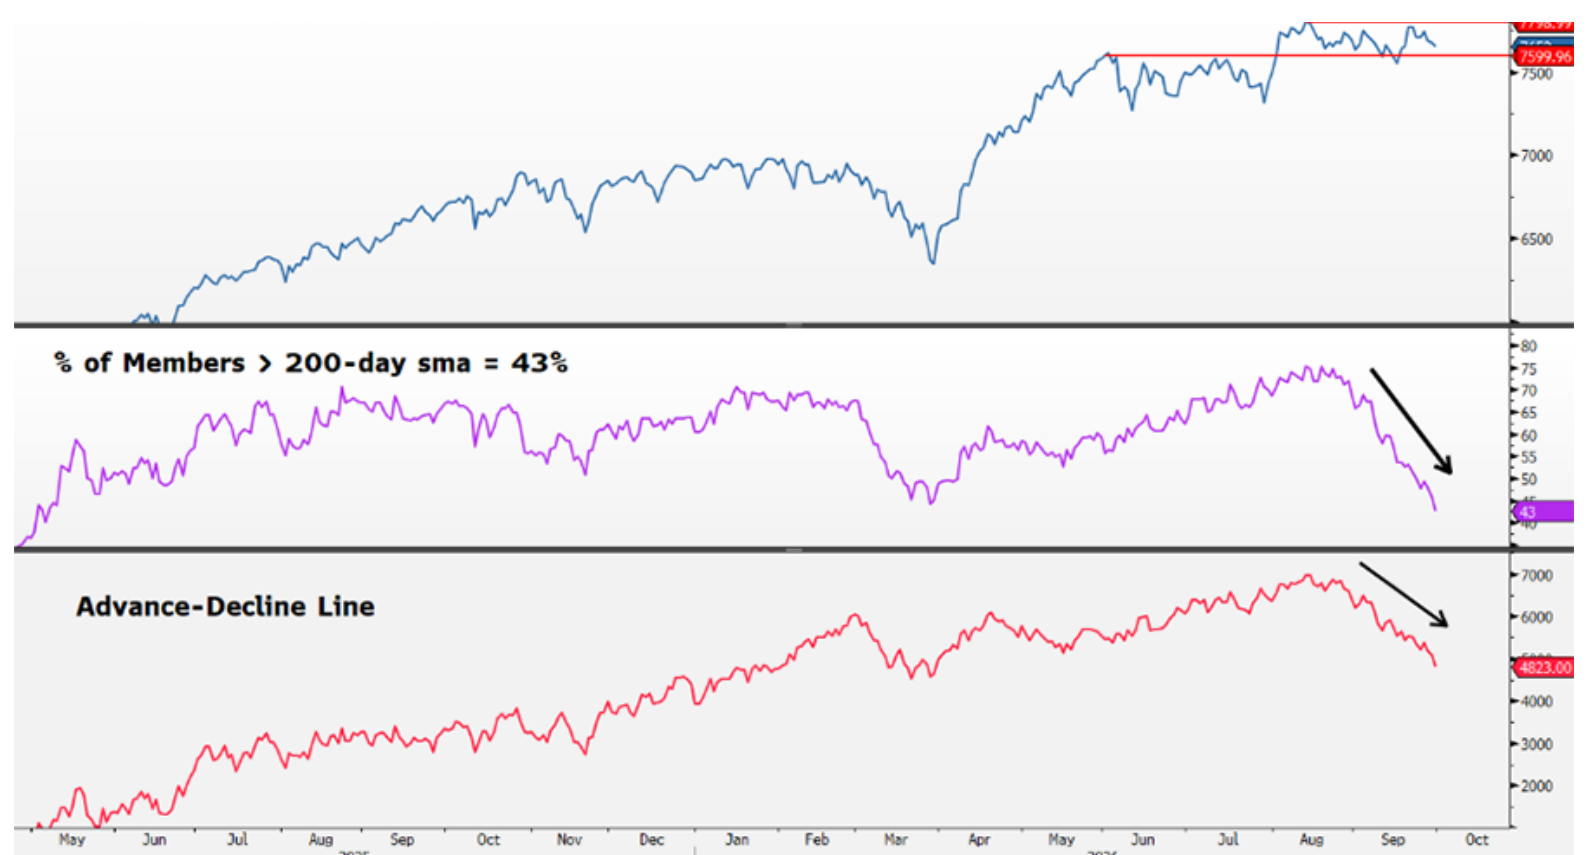
"It's AI or bust," as Steve Sosnick, chief strategist at Interactive Brokers, put it at the start of October. Breadth was healthy for most of this year, though. Equal-weighted, the S&P 500 is up 10% and small caps nearly 14%, so this narrowing is a third-quarter story. Research cited by Barron's also finds that weak breadth on its own has not been a reliable short-term bearish signal. What narrowing does reliably is make index returns depend on a handful of companies, which brings the argument back to Tests Two and Four.
Between June 1999 and May 2000 the Fed raised rates six times, from 4.75% to 6.5%, into a market where a narrow group of technology stocks kept rising after the rest had stalled. Then, as now, the leaders looked immune to tighter money until the moment they weren't.
Closest Rhyme Is Fibre
Pets.com is the comparison that comes up first. It is also the wrong one. Pets.com had a sock puppet and very little revenue. OpenAI has hundreds of millions of weekly users and a run rate near $50 billion. Many dot-com start-ups failed because customers would not pay enough for what they sold. That is not this cycle's failure mode.
A closer rhyme is the telecom build-out of 1996 to 2001, which ran alongside the dot-com mania and ended in a far more expensive bust. Demand for internet capacity was real and growing fast. Carriers extrapolated it, borrowed heavily in the high-yield market and nearly tripled their annual capital spending, to around $110 billion by 2000, or 1.1% of GDP. Equipment makers such as Lucent and Nortel lent their customers money to buy their gear. By mid-2001 Merrill Lynch estimated that just 2.6% of the fibre capacity laid in the US was lit. Analysts expected bandwidth prices to fall another 60% that year after similar falls in 2000. More than 60 telecom companies failed between 2001 and 2003.
Credit cracked first then, too. Research by Edward Altman and colleagues at NYU shows high-yield default rates rising from 1.6% in 1998 to 4.15% in 1999, the same year the Nasdaq posted its biggest annual gain. Equities peaked in March 2000. Bond investors had been pricing rising risk for a year before stock investors accepted it.
Set side by side, the two booms share their mechanics and differ in a few ways that decide the ending.
| Feature | Telecom build, 1996–2001 | AI build, 2023–2026 |
|---|---|---|
| Scale of spending | About $110 billion a year at the peak, roughly 1.1% of GDP | About $745 billion from four companies in 2026; 3.6% of GDP a year projected to 2032Larger now |
| Who spends | Leveraged carriers and start-ups such as WorldCom and Global Crossing | Four highly profitable giants at the core; neoclouds, Oracle and project vehicles at the edgeStronger core |
| How it is funded | High-yield bonds and vendor financing | Investment-grade bonds, private credit, off-balance-sheet leases and vendor financingSame mechanics |
| Price of capacity | Bandwidth prices falling by more than half a year by 2001 | GPU rental contracts up about 40% in six monthsShortage, for now |
| Life of the asset | Fibre lasts decades; lines laid in the 1980s are still in use | AI chips three to six years; buildings and power decadesShorter-lived |
| Valuation of the leader | Cisco above 100x earnings, 14% net margin | Nvidia 17x forward earnings, net margin above 50%Far cheaper |
| Monetary policy | Fed funds raised from 4.75% to 6.5%; 10-year near 6.2% at the top | First hike since 2023, to 3.75–4.00%; 10-year at 5.29%Tightening into a boom |
| Household exposure | Equities 26.7% of household wealth at the dot-com peak | Equities 34% of household wealth in mid-2026; AI-linked stocks worth 100% of GDPDeeper now |
Three rows in that table matter more than the rest. First, the core spenders are far stronger. WorldCom and Global Crossing borrowed to build and went bankrupt. Alphabet, Amazon, Meta and Microsoft can absorb enormous write-downs without failing. In this cycle the leverage has been pushed out to the edges, to neoclouds, Oracle, special-purpose vehicles and private credit, where it is harder to see and harder to measure.
Second, prices for computing are still rising, while bandwidth prices were already falling hard by 2000. That buys time.
Third, and working against the bulls, the assets age much faster. Franklin Roosevelt, campaigning in September 1932, observed that "the American investor paid for the American railway system more than three times over" and that "despite this fact the net advantage was to the United States." His point was that track outlived its owners' losses. Telecom investors lost fortunes; the dark fibre they buried carried the streaming economy a decade later. Part of today's build will leave a similar legacy – power plants, transmission lines, substations and data-centre shells will be useful for decades, which is the part of this story our August study of power bottlenecks examined. Chips will not. A GPU bought in 2026 will be written off long before the lease on the building that houses it expires. Per dollar spent, this boom will leave less behind than the fibre boom did.
Best Argument Against This Study
Anyone defending the boom would begin with the one thing a bubble cannot fake – customers paying more every month for a product in short supply. TSMC cannot make chips fast enough. GPU rents rose through the spring. Model makers' revenue has at least tripled in a year. Enterprise customers increasingly pay by usage, which means revenue arrives only when the software is doing real work. Fibre sat dark in 2000. Today's data centres are spoken for before they are finished.
They would add that these spenders own some of the strongest balance sheets in corporate history, that Fed staff credit this year's gains to earnings rather than speculation, and that Nvidia trades at a lower multiple than the index. Serious bears also have a habit of being early. Greenspan was early by more than three years. Nouriel Roubini called the March 2009 rebound a dead-cat bounce; the S&P 500 then rose more than 225% within ten years. Even the ECB economists who expect a correction concede the upside case in a single line.
"If AI proves to be transformative enough, valuations could still be much higher in the future, even after a correction."
Malin Andersson, Johannes Breckenfelder, Stefano Corradin, Kalin Nikolov and Maria Antonietta Viola, ECB Blog, August 17th 2026Finally, they would argue the build-out is already spreading beyond technology. UBS estimates that each dollar of AI capital spending this quarter generates about $1.50 of further investment the following quarter, with only about a third of that follow-on spending going to technology. And even Ryan Cummings, co-author of the gloomiest arithmetic in this study, expects "trillions of dollars of profits" to be up for grabs eventually.
My answer to it
I agree with most of that. It changes the shape of my conclusion more than its direction. Demand is real, which is why my base case is a slow leak rather than a pop. But Cummings' own qualifier matters more – trillions of profit eventually, "just not in this super-accelerated timeline that is required to justify the investments." A shortage tells you a product is wanted. It says nothing about whether whoever paid for the capacity earns back its cost of capital before the equipment is obsolete. Our August study made the same point about electricity. It applies with more force to chips.
Timing is where the two cases part company. A bullish outcome needs patience from customers and creditors at the same time. Customers are showing it. Creditors, pricing CoreWeave at a 63% default probability and ten-year Treasuries above 5%, are not.
Two more risks are specific to this cycle. In September the industry's own leaders began talking publicly about slowing down. Anthropic's Dario Amodei published an essay calling for the pace of frontier development to be deliberately slowed. OpenAI's Sam Altman, Google DeepMind's Demis Hassabis and Elon Musk voiced support, while Microsoft's Satya Nadella was more guarded. Nvidia fell about 3% on the next trading day. It is hard to find a railroad promoter who ever proposed laying less track. When the people placing the orders discuss restraint, demand forecasts behind trillions of dollars of commitments acquire a political variable that is very hard to model.
A second risk works through the same channel... efficiency. If models need far less computing power to reach the same capability, the demand curve under all those commitments shifts down. On Tuesday the IMF cited "growing evidence" of exactly that. Burry's September essay argued it from first principles; the DeepSeek scare of January 2025, which wiped $589 billion off Nvidia in a single session, showed how quickly that idea can reprice a supply chain.
Three Endings, Weighted
Probabilities on a question like this are judgement calls. Mine could easily be ten points off in either direction. They cover the period to the end of 2027.
AI revenue keeps compounding fast enough to close most of the gap by 2028. Capital-spending growth slows the way Goldman models it, from about 54% next year to about 12% in 2028. Free cash flow at the big four turns positive again. Neocloud stress stays confined to one or two names.
What it means: multiples hold, the index grinds higher with earnings, and this autumn's warnings read like Greenspan's in 1996.
Spending still grows in 2027 but decelerates sharply as funding costs bite and returns disappoint. Supplier earnings stop growing, their multiples compress, and part of the index's earnings growth evaporates without a single default among the giants. Credit losses build at the edges, in neoclouds, project vehicles and private credit funds.
What it means: a long de-rating of AI hardware, plausibly 25–40% over twelve to eighteen months, with the S&P 500 spending that time 10–20% below its peak and no recession. This is my base case.
A funding shock arrives first, whether a mega-listing that cannot price, a lab that cannot meet its commitments, or a 10-year yield pushing toward 6%. Hyperscalers cut 2027 budgets outright, supplier earnings fall hard, private AI valuations are marked down and the mark-to-market gains on AI stakes reverse into losses.
What it means: a negative wealth effect tips America into recession, AI stocks fall 40–60% from their peak and the S&P 500 by 25–35%, and the Fed is forced into reverse.
Those weights put 75% on some form of deflation and only a quarter on a clean escape, which is what a bubble verdict means in practice. My weights fall between the published views of the institutions. Capital Economics expects the rally to run to 8,250 this year before a fall to 6,500 by the end of 2027, close to my slow-leak path with a later start. Goldman Sachs targets 8,000 by year-end on earnings of $340 a share, a forecast that needs the spending loop to keep turning. Economists at the ECB expect a correction; the IMF now treats one as a leading risk to financial stability.
I differ from all of them on the order of events. I expect the credit market to announce the turn before earnings or valuations do. On this week's evidence it has started to. In Kindleberger's sequence, that places this autumn somewhere between euphoria and distress. Distress has reached credit's edges, while euphoria still owns the index.
What Would Change My Mind
A verdict that cannot be marked wrong is not worth publishing. These are the readings I will be tracking over the next two quarters, with what each would tell me.
Three outcomes would make me rewrite this study rather than defend it. If the four hyperscalers return to positive free cash flow in 2027 without net new borrowing, Test Four no longer holds. If AI revenue from customers outside the AI industry passes Goldman's break-even of about $300 billion a year while spending keeps rising, Test Three falls. And if spreads on the weakest AI borrowers narrow while capital spending grows, lenders will have voted for the bulls with their own money.
Any two of those together and I would downgrade this from a bubble to a build-out with excesses.
Reasonable multiples are what this boom shows the stock market. Unreasonable money is what it shows the bond market. Most bubbles are remembered for their prices. This one, I suspect, will be remembered for its paperwork – the leases, guarantees and side vehicles that let a trillion dollars of spending look like something smaller. Prices tell you what investors believe. Paperwork tells you who pays when they stop believing.
Ian Andy, Bellwether Research Desk, October 16th 2026