Gold and silver just did something that should have every portfolio manager's full attention. Gold punched through to $4,568 per troy ounce. Silver ripped 4.54% higher to $83.58. The catalyst? A Federal Reserve crisis that reads like political fiction - except it's real, and the money flooding into precious metals says the market is taking it dead seriously.
But here is the question that matters more than any price target: is this move structural, or does it fade with the headlines? I've been tracking precious metals positioning for months, and the evidence points firmly toward the former. Gold and silver were already in an institutional re-rating cycle well before anyone had heard of the Fed crisis. What the crisis did was compress into a few days a re-pricing that fundamentals had been building toward for months. Think of it like a dam. The water was rising steadily - supply deficits, sovereign buying programs, de-dollarization flows. The Fed crisis just blew a hole in the wall. And when safe haven panic lands on top of a market that's already structurally tight, the upward move feeds on itself in ways that pure crisis spikes almost never do.
Federal Reserve Crisis Triggers Precious Metals Surge
Gold blew past its previous ceiling to hit $4,563.61 per ounce after news broke that federal prosecutors had opened criminal investigations into Federal Reserve operations. A 1%-plus move to a fresh record high on the year. And the trigger wasn't inflation data or a rate decision - it was something far more unsettling.
Federal Reserve Chairman Jerome Powell revealed that the U.S. Department of Justice had issued subpoenas to the Fed and threatened criminal indictment - over testimony before the Senate Banking Committee about facility renovation spending. The whole thing centers on a $2.5 billion renovation of the Fed's Washington headquarters that Powell discussed during June hearings. A criminal probe into the central bank. Let that sink in for a moment.
Powell, in a video statement, was blunt about what he thinks is really going on: the investigation stems from ongoing clashes with administration officials over monetary policy independence. Read between the lines and the picture gets uncomfortable fast. The criminal threat appears tied to the Fed setting interest rates based on its own institutional judgment rather than political preferences. That is not a renovation dispute. That's a fight over who controls the money supply.
The World Gold Council has been saying this for years: gold's biggest demand surges don't come from a few ticks of extra inflation. They come when investors start questioning whether the monetary framework itself is reliable. And threats to central bank independence - real or perceived - sit right at the top of that list, because they undermine confidence in the long-run anchor for fiat currency values. What's happening with the Fed investigation fits that pattern like a glove.
Silver, though, stole the show. A 4.54% single-session rocket to $83.58 per troy ounce. Over the trailing twelve months, silver is up 181.78%. That is not a typo. The white metal is being pulled higher by two forces at once - safe haven panic and genuine industrial hunger - and when those two currents align, the moves get violent.
Retail brokers scrambled to respond - and not in any coordinated way. Some actually increased available leverage on gold positions (make of that what you will), while others slapped on volatility warnings and temporary trading restrictions. The split reaction tells you something: nobody's playbook had "criminal investigation of the Federal Reserve" in it.
Gold Technical Analysis: Price Discovery Phase
Gold is now in price discovery mode - trading above every previous all-time high with no overhead resistance on the chart. That sounds exciting, and it is, but confirmation matters here. We need daily closes above prior resistance levels before getting too comfortable that this momentum has legs.
Fibonacci extensions give us a roadmap. The 100% extension lines up with $5,000 - and that number keeps showing up everywhere, from Goldman Sachs research desks to independent chartists. It is not just a round number people like the sound of. Goldman's commodity team has pointed out that $5,000 sits at the confluence of Fibonacci resistance and the upper band of their central bank demand scenario. So you have technical and fundamental frameworks pointing to the same level independently. That kind of convergence is worth paying attention to.
On the downside, recent price action carved out some clear support levels. The October peak around $4,360 is the first zone buyers should step in. Below that, the 50-day exponential moving average (50 EMA) sits near $4,255 per ounce. If gold pulls back - and it will at some point, every rally needs to breathe - those are the levels to watch.
The line in the sand? The 200-day exponential moving average (200 EMA) at $3,730 per ounce. A break below that, and the bull thesis is in serious trouble - you'd be looking at a genuine trend reversal, not just a healthy pullback. Right now, with the kind of buying pressure we're seeing, that scenario feels remote. But it's the number to have tattooed on your risk management dashboard.
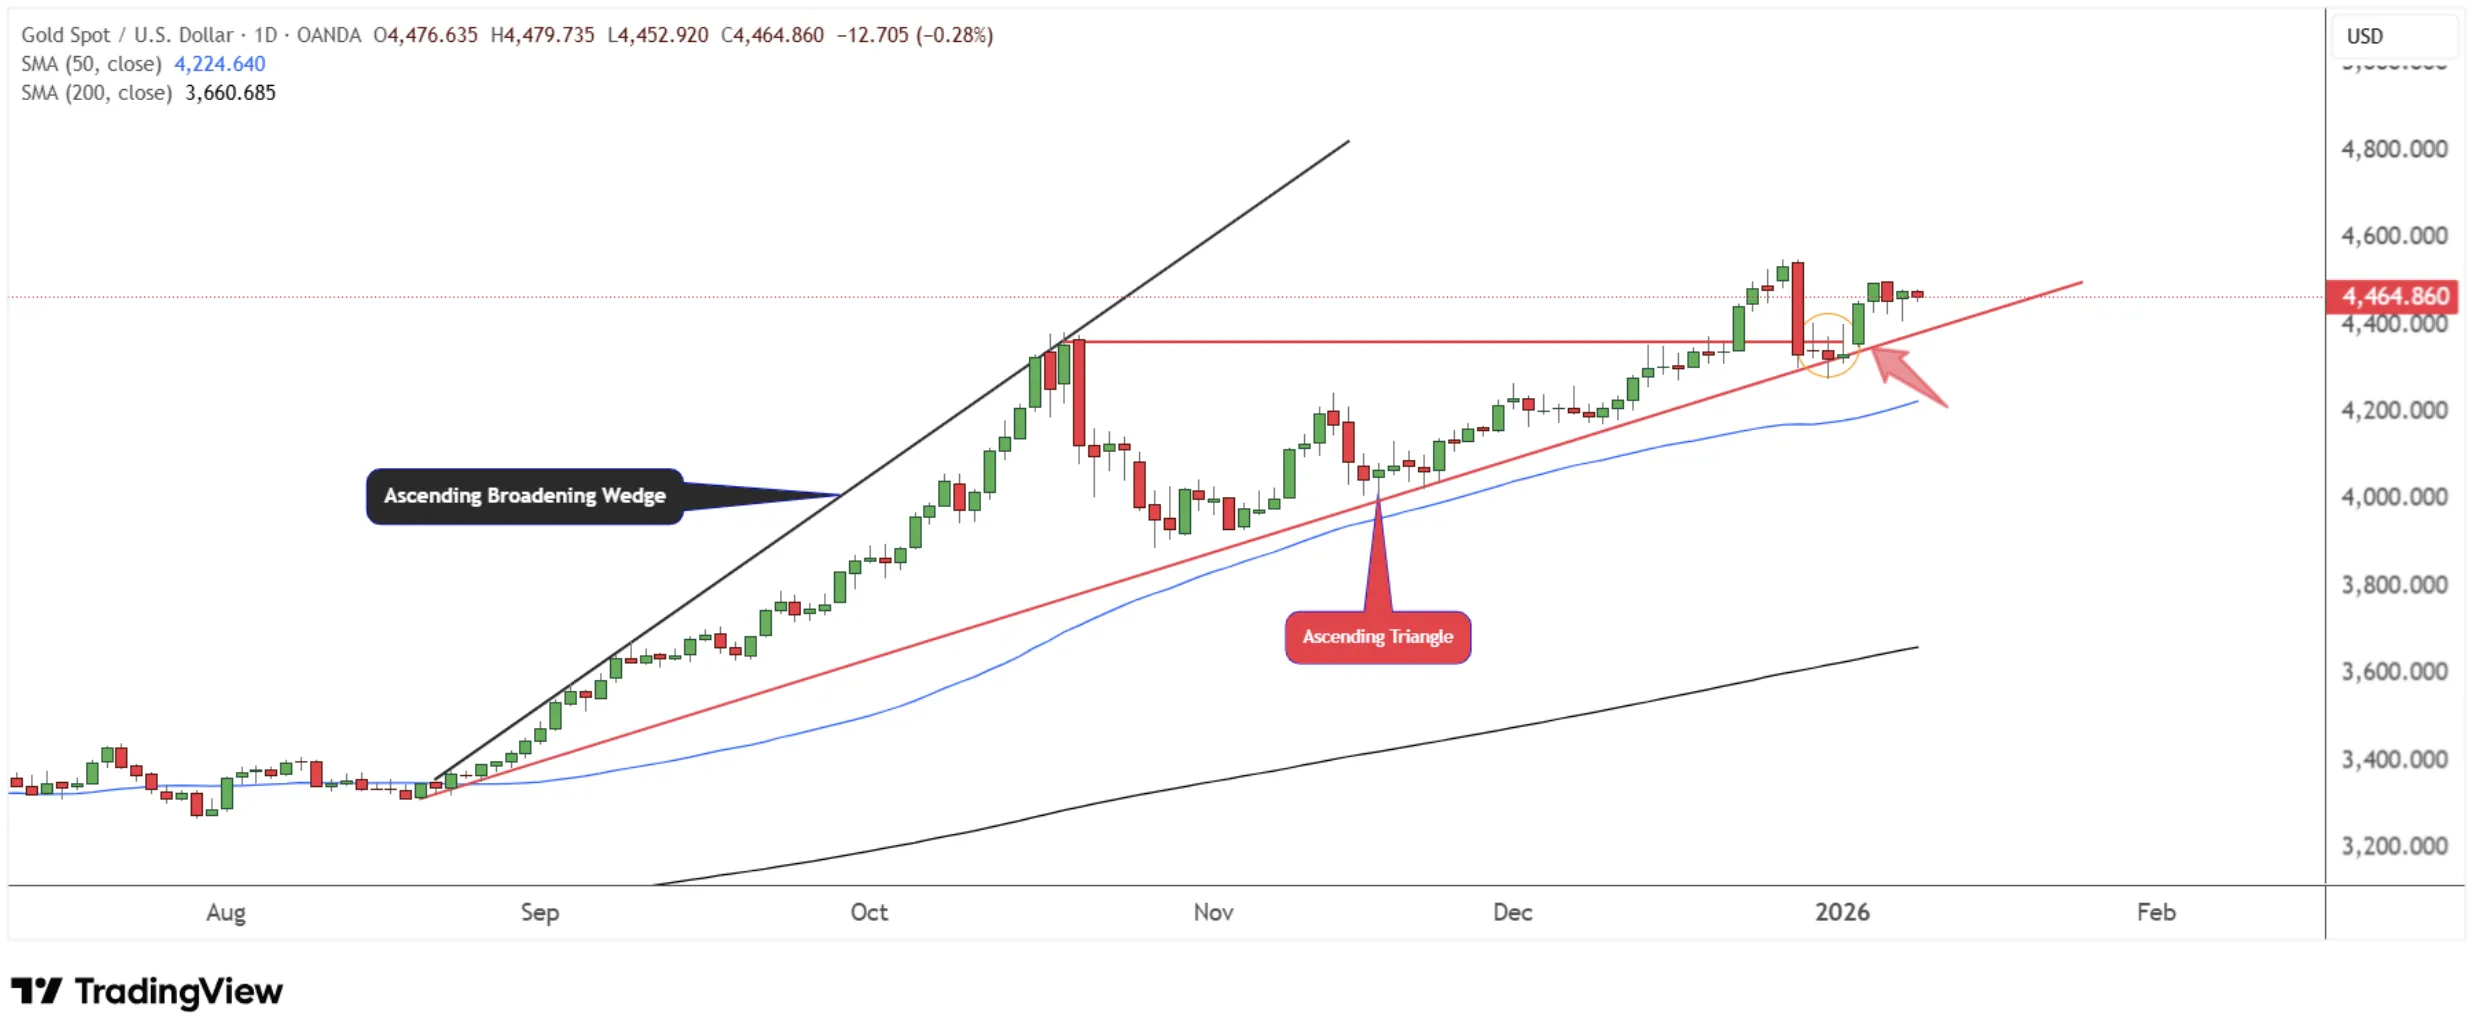
Gold Spot / U.S. Dollar - Daily Chart (TradingView)
The daily chart tells a straightforward story. Gold is choppy above the $4,360 support, testing it again as we speak. Lose $4,360 and you're looking at $4,250 next, possibly $4,000 if sellers really pile on. But if $4,360 holds - and so far it has, repeatedly - that's coiled energy building for a breakout above $4,550. And once $4,550 goes decisively? The path to $5,000 opens up fast.
Key Gold Technical Levels
- Current Price: $4,568 (new ATH, price discovery phase)
- Next Target: $5,000 (100% Fibonacci extension)
- Support 1: $4,360 (October 2025 peak)
- Support 2: $4,255 (50-day EMA)
- Critical Support: $3,730 (200-day EMA - bearish invalidation)
- Trend Status: Bullish until break below 200 EMA
Silver Technical Analysis: Outperformance Dynamics
Silver's chart looks even more aggressive than gold's. Over 5% in a single session, pushing above $84 per ounce - slightly past the December 29 peaks, which (not coincidentally) is the same date gold set its previous highs. Both metals moving in lockstep like that is not random. It tells you the buying is broad-based and conviction-driven.
Running Fibonacci extensions from the April lows through the October peaks at $54 per ounce and then the corrective decline, the 100% extension landed around $72 per ounce. Silver blew right through it. That target is in the rearview mirror now - and the fact that the framework nailed the level before it was exceeded gives the next projection some credibility.
That next target? The 161.8% Fibonacci extension at roughly $88 per ounce - just a few dollars above where we are now. And some analysts think $88 is conservative, frankly. Their silver-versus-dollar projections go well beyond anything the Fibonacci math suggests. Whether they're right or delusional is a different conversation, but the direction of the consensus is clear.
Here's what keeps me cautious, though. Look at where the moving averages actually are. The 50-day EMA is down around $64. The 200-day EMA? Near $48. Silver is trading at $83-plus. That gap is enormous - like a rubber band stretched to its limit. It doesn't mean prices can't go higher. But if momentum stalls even briefly, the snap-back could be brutal and fast.
The numbers are staggering when you lay them out. Silver gained 150% in 2025. Since January 2026 started, it's tacked on another 17% - which, by the way, equals the S&P 500's entire 2025 return. In days. Let that comparison sit for a moment. Over the past month alone, silver is up 30.50%. Twelve-month returns: 181.78%. This is not a normal commodity move. It's a market being repriced by two structural forces - safe haven flows and industrial demand - hitting at the same time.
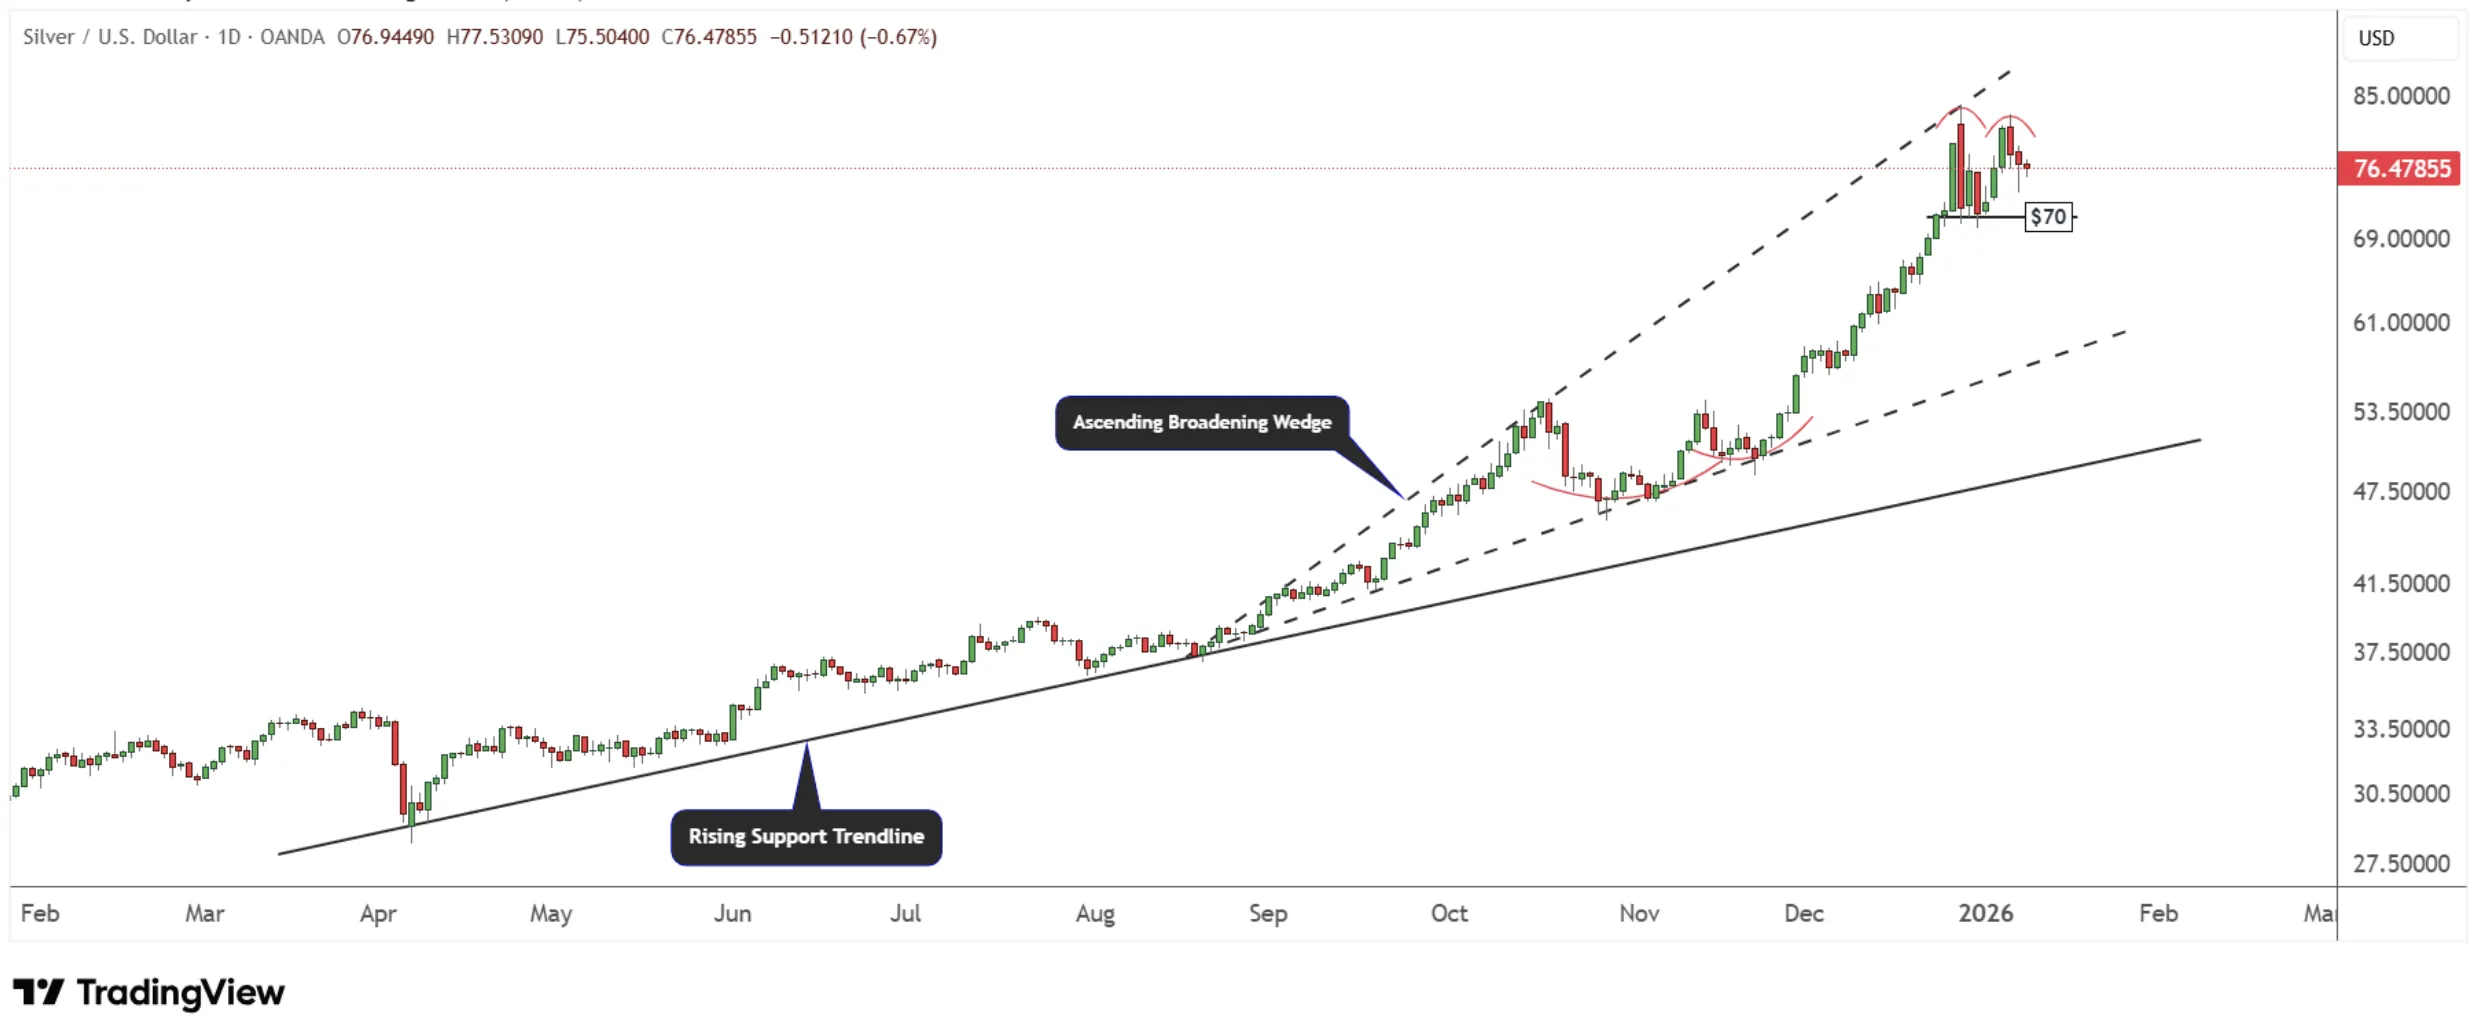
Silver / U.S. Dollar - Daily Chart (TradingView)
The daily chart for spot silver (XAG) reveals the buildup of a topping pattern at the $84 area, as the price appears exhausted in the short term. A double top pattern is forming with a neckline at the $70 area. A break below $70 would confirm the pattern and indicate further downside toward the $60–$65 support zone. As long as $60 holds, the next major move in silver will likely be higher - targeting the $100 area. A break below $60 would take silver prices toward the rising trendline around $50, which serves as long-term support for 2026.
Key Silver Technical Levels
- Current Price: $83.58 (exceeding December 29 highs)
- Next Target: $88 (161.8% Fibonacci extension)
- Previous Target: $72 (100% Fibonacci - exceeded)
- Support 1: $64 (50-day EMA - significantly below)
- Support 2: $48 (200-day EMA - shows trend strength)
- 2025 Performance: +150%
- 2026 YTD: +17% (matches S&P 500's entire 2025 gain)
- Warning: Large distance from moving averages suggests overextension risk
The Industrial Demand Squeeze
With a raging AI infrastructure boom and the ongoing electrification of practically everything, industrial demand for silver is red-hot. This is what makes the current bull market fundamentally different from the previous peaks of March 1980 and April 2011. Even if the COMEX raises margin requirements to keep a lid on prices, the effect will be temporary at best, because the core buyers are industrial in nature. They are hungry for the metal not to speculate, but to manufacture real-world goods - solar panels, batteries, and AI GPUs.
The recent off-take agreement between Samsung and Silver Storm (SVRS:CA) to restart the La Parrilla silver mine in Mexico is a perfect case in point. The $7.0 million deal is small in the grand scheme of things, but it sends a strong symbolic message: end-users are now reaching upstream to secure physical supply.
In a sense, the AI infrastructure boom merely broke the camel's back. Industrial demand was rising rapidly well before OpenAI released ChatGPT in November 2022. If AI data centres are among the most electricity-hungry facilities on Earth, should we be surprised that they also have a tremendous appetite for the element with the best electrical conductivity on the periodic table?
In the midst of rising geopolitical tensions between the United States and China, developments surrounding artificial intelligence have become a matter of national security. The strategic importance of AI may be one of the core reasons why the U.S. Geological Survey added silver to its critical minerals list in November 2025.
According to the 2025 World Silver Survey, industrial demand now accounts for almost 60% of global demand, up from approximately 50% a decade ago. Given the structural demand growth from photovoltaics, electric vehicles, and AI applications, industrial demand could increase to more than 70% of global demand sometime in the 2030s. This is a critical distinction: metal flowing into the industrial channel is ultimately consumed - not stored in vaults, as is the case with monetary demand. The Silver Institute has highlighted that this consumption-versus-storage distinction makes silver's supply dynamics structurally tighter than gold's - because industrial silver cannot be easily recycled back into tradeable bullion form at scale, effective above-ground availability shrinks faster than headline production and stockpile data suggest.
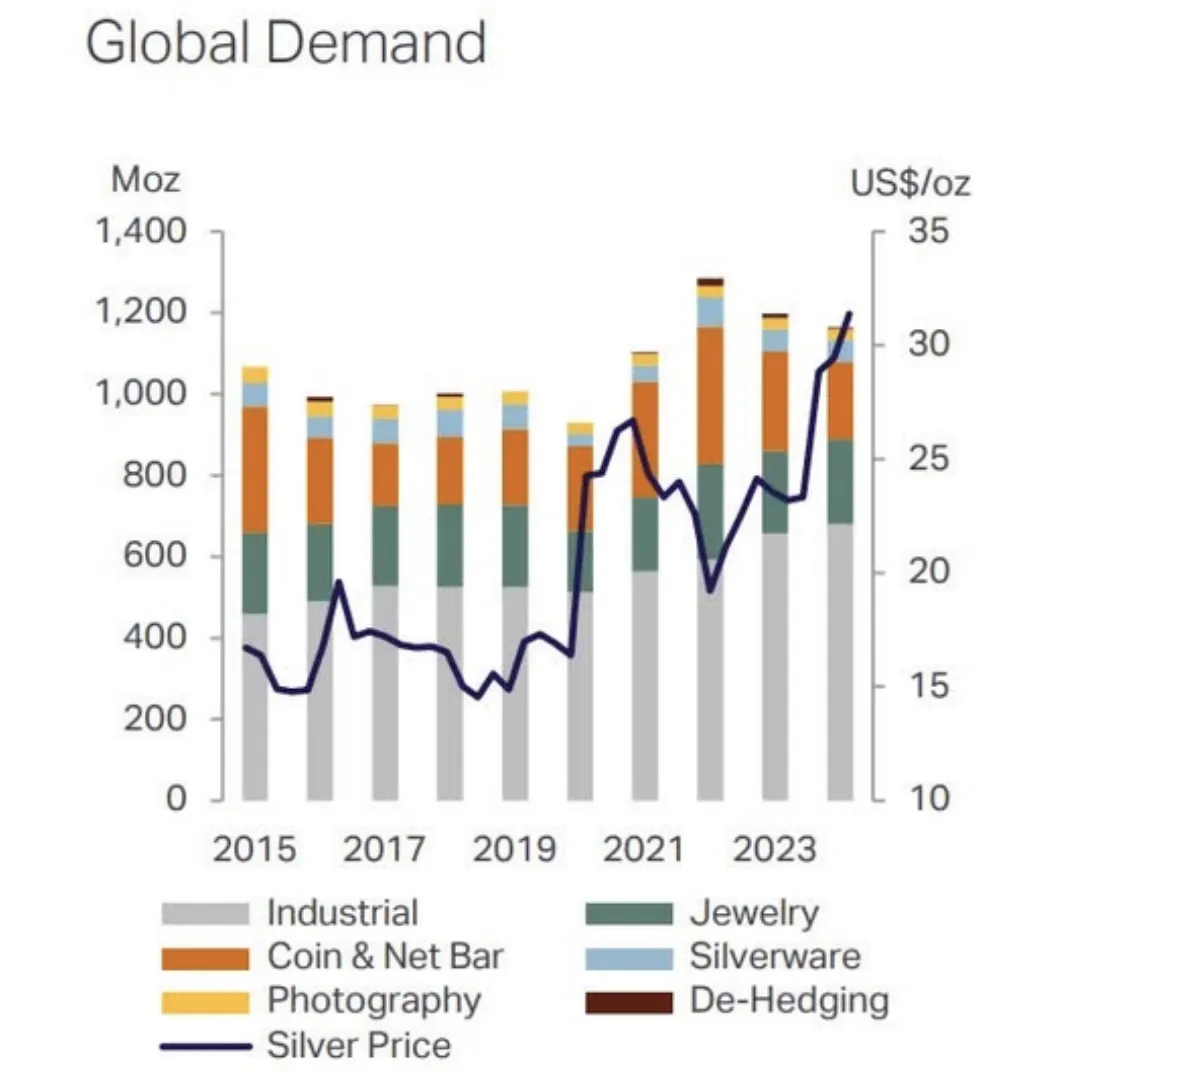
Global Silver Demand (Metals Focus, Bloomberg)
Automotive Silver Demand: The EV Transition
The electrification of the automotive industry is clearly supportive of silver demand, though there are important caveats. The upper and lower bands of silver consumption by powertrain type are wide, meaning global demand estimates could be skewed in either direction. As the number of electronic functions per vehicle increases - and the move towards autonomous driving boosts the need for sensors and ECUs - silver loading per vehicle is likely to rise over time. On the other hand, efforts to consolidate multiple ECUs into single domain control units could dampen demand at the margin. On balance, the transition to EVs is expected to boost silver consumption, particularly through the increasing use of electrical and electronic components.
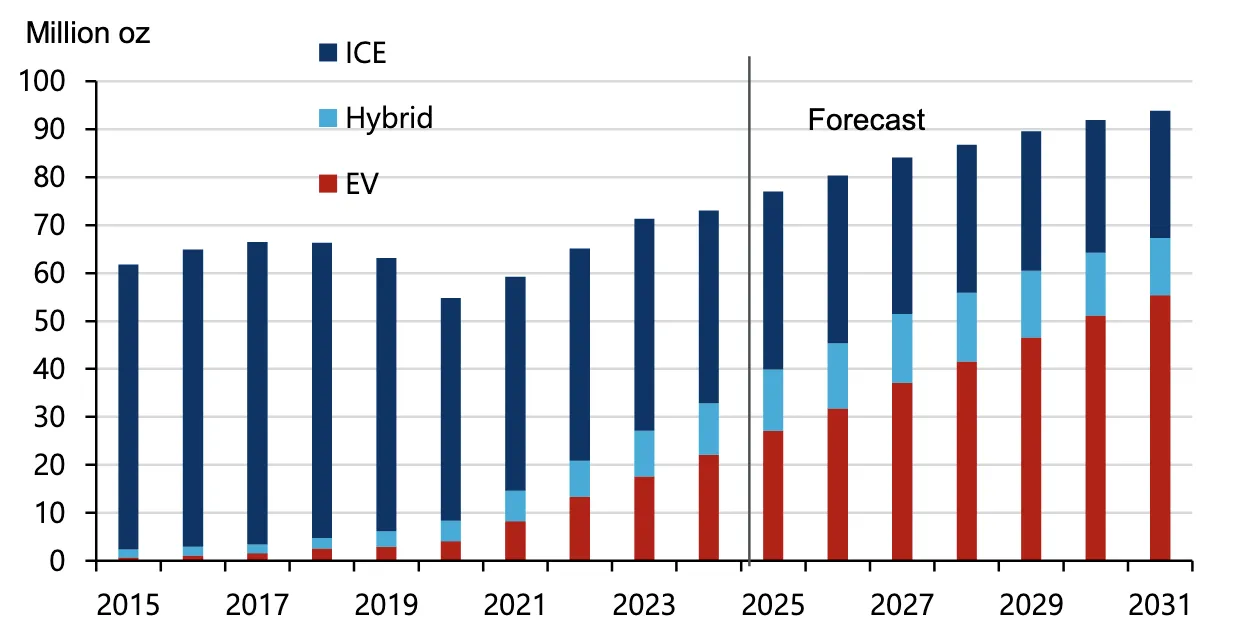
Silver Demand by Automotive Powertrain - ICE, Hybrid, and EV (2015–2031 Forecast)
Solid-State Batteries: A Potential Game-Changer
Another potential catalyst for silver's industrial demand is the development of solid-state batteries for electric vehicles. Samsung is at the leading edge with a technology promising a 600-mile range, 9-minute charging, and 20-year lifespan, using a silver-carbon anode. Toyota is developing a similar technology, also targeting over 600 miles on a single charge. Though mass commercialisation has not yet arrived, this could be a game-changer not only for the EV industry but also for silver demand.
According to various estimates, next-generation solid-state batteries could require up to 1 kilogram of silver for every 100 kWh vehicle battery pack. With 17.3 million electric cars produced globally in 2024, even a modest 10% penetration rate would mean 1.7 million solid-state batteries consuming approximately 55 million ounces of silver - roughly 5% of total global demand. Mass adoption remains in the future, but the potential impact on industrial demand through the 2030s is significant.
Data Centres & AI: The Silver-Hungry Infrastructure Boom
The surge in data consumption and adoption of AI technologies has driven a rapid increase in data centre construction globally. The number of data centres worldwide has grown elevenfold since 2000, with over 4,600 facilities operating today.
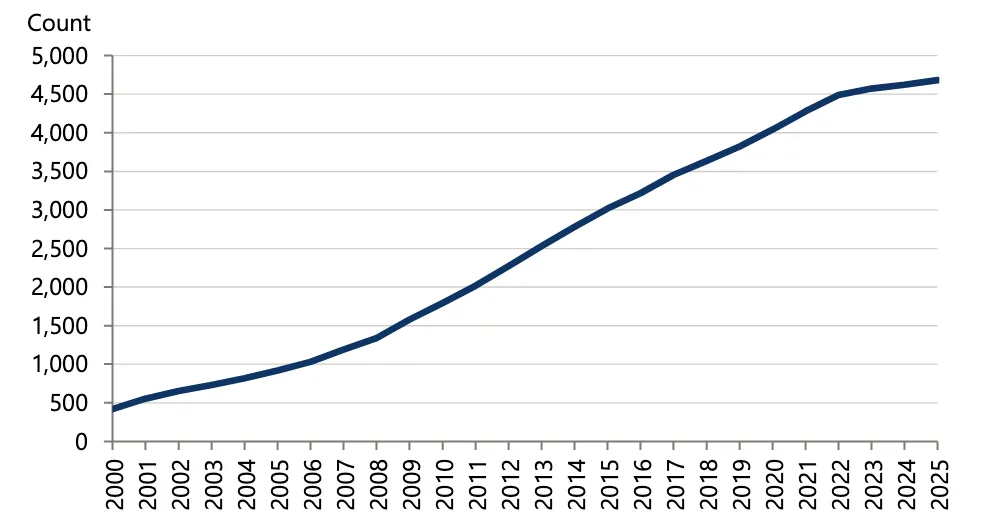
Global Stock of Data Centres, 2000–2025
However, a simple count of facilities does not capture the full scale of expansion. While the number of data centres grew 11x since 2000, total global IT power capacity - the computing capacity of servers, storage, and networking devices - grew an estimated 53x, from 0.93 GW to nearly 50 GW in 2025. This exponential rise reflects a shift towards fewer but significantly larger and more powerful facilities, each containing more servers, switches, and cooling systems that require silver in their core components.
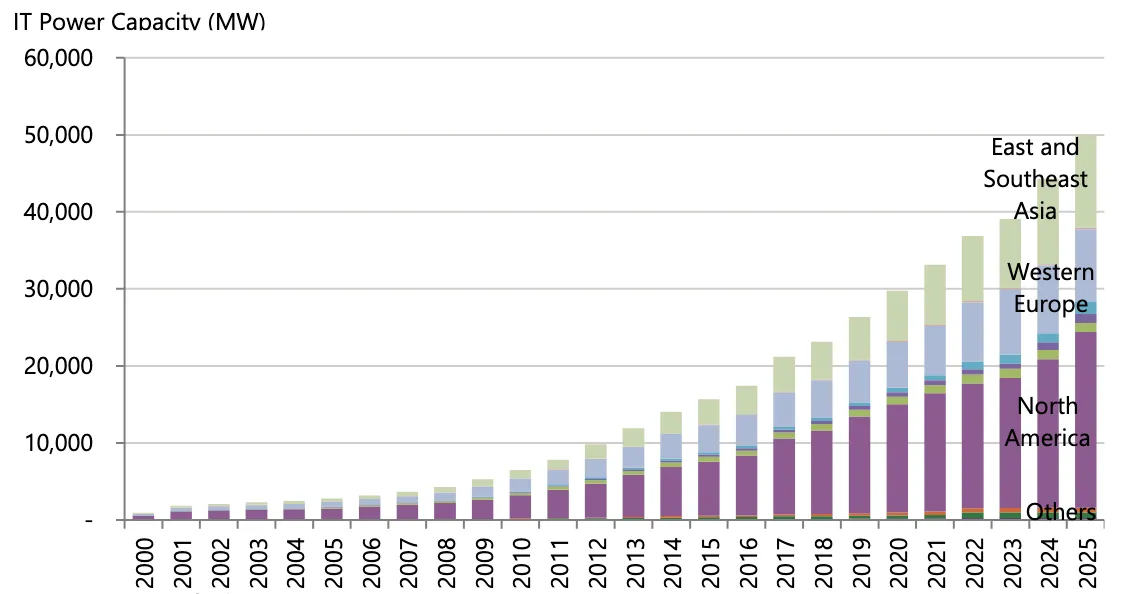
IT Power Capacity by Region, 2000–2025 (MW)
Data centre computing capacity is currently concentrated in three regions: North America, Western Europe, and East and Southeast Asia account for 88% of global computing capacity. As demand for digital services expands to Latin America, South Asia, and Africa, data centre construction - and silver demand - will follow. While AI model training can be performed remotely, latency-sensitive applications such as real-time cloud services, high-frequency trading, and search engines require proximity to end users, driving geographic expansion.
The United States alone accounts for over 22.57 GW of estimated IT power capacity. Looking ahead, data centre construction in the U.S. is forecast to grow by 57% over the next decade, providing a clear benchmark for expansion in other established markets.
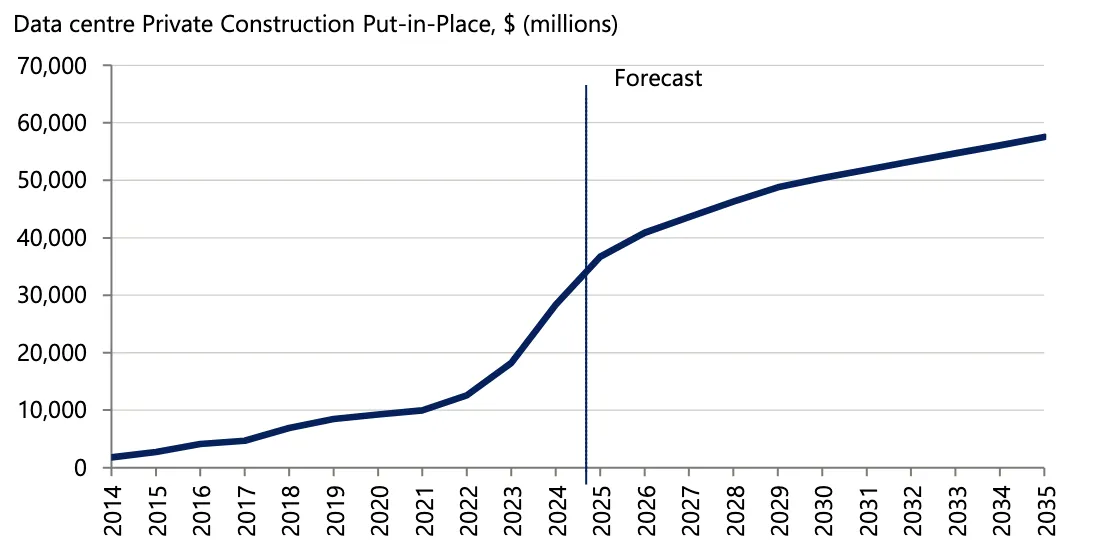
U.S. Data Centre Private Construction Put-in-Place, 2014–2035 Forecast ($ millions)
And it's not just the data centres. AI is pulling silver demand through the entire hardware ecosystem. GPUs, TPUs, NPUs - the specialized chips powering everything from language models to image generation - all rely on high-performance semiconductors that use silver in their internal connections and packaging. Then you have everything downstream: autonomous vehicles, robotics, edge computing devices. All of it packed with silver-rich components - fuses, switches, sensors. The demand is cumulative and it's compounding.
Industrial demand for silver hit a record in 2024: 680.5 million ounces, driven by record electronics and electrical consumption tied to AI applications in consumer electronics and hardware. That number will look quaint in a few years.
Monetary Demand Adding Fuel to the Fire
Silver occupies a weird corner of the commodity world. It's both industrial and monetary - not purely one or the other like copper (industrial) or gold (monetary). That dual nature means it catches tailwinds from both directions simultaneously. And right now, the monetary side of the equation looks every bit as strong as the industrial picture. Maybe stronger.
JPMorgan's precious metals desk flagged something important: gold's relationship with real interest rates - historically its most reliable valuation anchor - broke down after 2022. Gold kept climbing even as real rates surged. JPMorgan's explanation is that we've entered a new demand regime driven by central bank accumulation, and those buyers simply don't care about rates the way investment funds did in the prior decade. What that means in practice: any further Fed rate cuts pour gasoline on a fire that's already burning for completely independent reasons.
Monetary demand for silver is notoriously hard to pin down. But the Silver Institute pegs demand for bars and coins at roughly 200 million ounces in 2024. Add in net investment demand through ETFs - the iShares Silver Trust (SLV), Sprott Physical Silver Trust (PSLV), abrdn Physical Silver ETF (SIVR) - and you get approximately 250 million ounces. Treat those numbers as rough guides, not gospel. But the direction is clear.
Monetary demand for silver swings wildly. Always has. But look at the macro backdrop and tell me it's going down from here. The U.S. national debt sits at $38.4 trillion - up more than $2.0 trillion in 2025 alone, and that was a relatively calm year. No recession, no war, no pandemic. Just business as usual adding $2 trillion. At this pace, the debt crosses $40.0 trillion sometime in 2026. And the question that keeps getting louder on trading desks: how long before a genuine crisis of confidence hits the Treasury market?
Expert Gold Price Predictions: $5,000-$6,000 Targets
The big banks have updated their gold targets for 2026, and the clustering around $5,000 is hard to ignore - it lines up with the Fibonacci level we just discussed. When technical and fundamental frameworks independently converge on the same number, that's worth paying attention to.
Realistic Scenario: $5,000 Per Ounce
$5,000 gold isn't a fringe prediction anymore. It's becoming the base case among professional traders. Central bank buying continues, the Fed is pivoting toward cuts, and retail investors keep piling in. All three engines running at once.
What's notable is how conservative the big banks have been. Goldman and others are only now talking about $5,000 targets. Some analysts think those forecasts get revised higher as conditions evolve. Banks tend to lag moves like this - they raise targets after the price gets there, not before.
Extreme Scenario: $6,000+ Per Ounce
The most aggressive forecasts tie to geopolitical escalation - specifically territorial disputes. Under those circumstances, $6,000 wouldn't be a ceiling. It would be the floor. We'd be looking at a fundamental reshuffling of the international frameworks that have held since the 1940s.
The scenario involves potential military action over territories belonging to NATO allies - states that are also EU members. That kind of move would fracture alliances, trigger institutional crises, and send safe haven demand through the roof.
These aren't random territories, either. They sit on missile routes between major powers, contain significant rare earth deposits, and control year-round trade corridors. The strategic value is real, which is exactly what makes the geopolitical risk elevated.
Whether the approach is financial pressure or military coercion, any attempt at forced territorial acquisition would constitute a rupture in the established international order. Gold would be the first asset to reprice. Violently.
Major Bank Gold Forecasts
| Institution | 2026 Gold Forecast | Key Assumptions |
|---|---|---|
| Goldman Sachs | $4,900/oz (year-end) | Central bank buying, Fed cuts |
| JP Morgan Private Bank | $5,055/oz (Q4 average) | Institutional demand 566 tons/quarter |
| JP Morgan Private Bank | $5,200-$5,300/oz (potential peak) | Strong safe haven flows |
| Deutsche Bank | $4,450/oz (annual average) | Reserve diversification, range $3,950-$4,950 |
| Bank of America | $4,538/oz (annual average) | Continuation of 2025 trends |
Goldman sees $4,900 by year-end 2026 - central bank buying and Fed cuts doing the heavy lifting. JP Morgan's private bank is more aggressive: $5,055 average in Q4 2026, with potential spikes to $5,200-$5,300. That's not a moonshot call from a gold bug newsletter. That's JP Morgan Private Bank.
Deutsche Bank bumped their average 2026 forecast from $4,000 to $4,450, citing central bank reserve diversification and stabilizing investor demand. Bank of America pegs it at $4,538 average, assuming quarterly buying of about 566 tons from central banks and investors combined. The consensus is moving in one direction. Up.
Silver Price Predictions: $200-$500 Long-Term Targets
Silver's long-term price targets are where things get really interesting - and where you need to separate the signal from the noise. As the metal approached $80 in late December, prominent analysts started putting out predictions that would have sounded insane two years ago. Now they sound merely aggressive.
On December 29, with silver touching $80, $200 started getting thrown around as the next milestone. Bold? Sure. But the call came right before a correction that briefly validated the bears - before prices ripped back to new highs anyway.
Two days earlier, on December 28, cooler heads warned about "FOMO mania" and urged patience - wait for a pullback before jumping in. Smart advice, as it turned out. Silver dropped from $83 to $70 before recovering sharply. The people who bought the dip look brilliant.
The really aggressive calls? $500 silver from $100 within a year. A 5x return. That requires continued monetary accommodation and industrial demand accelerating beyond current projections. Not impossible. But not the base case either.
Expert Silver Outlook
There's a reasonable case that silver outperforms gold in 2026. Governments haven't been stockpiling silver the way they've been hoarding gold. Growth parity hasn't been filled. That creates catch-up potential - and catch-up moves in commodities tend to be violent.
Some people got spooked when exchanges raised margin requirements and silver dropped from $83 to $70. Declarations that the bull market was dead. But think about the math for a second. If something rises 60% and then corrects 15%, you're still up 45%. That's not a market collapse. That's a bull market doing what bull markets do.
The manipulation attempts - raised collateral requirements on American exchanges designed to cool things off - didn't work. The correction lasted days. Silver recovered to new highs almost immediately. When the underlying demand is real and structural, you can't paper over it with margin hikes. The physical market doesn't care about exchange rules.
A Generational Bull Market in Silver
I believe silver is in a generational bull market. Not a cyclical bounce, not a speculative fever - a structural shift driven by industrial demand that isn't going away. The AI infrastructure boom is just the latest accelerant on an already tight market, ripping away the paper illusion of abundance and exposing how precarious the physical supply picture actually is. For the first time in decades, it's the physical metal driving prices, not futures traders. And the dynamics here could escalate fast. Analyst sentiment is confirming it.
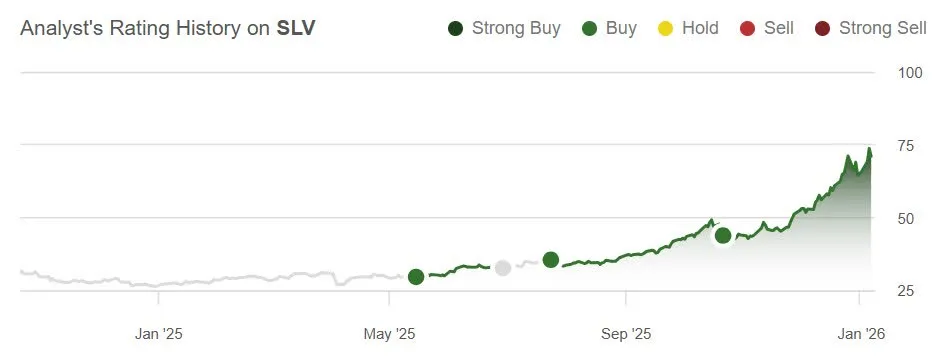
Analyst's Rating History on SLV (iShares Silver Trust)
Short-term, more metal has to come out of above-ground stockpiles. But here's the problem: silver's above-ground reserves are tiny relative to annual production - nothing like gold's massive vault holdings. And silver gets consumed. It goes into solar panels and semiconductors and doesn't come back. There's a hard ceiling on how much stockpiled metal can be released. The silver market has been running supply deficits for several years now, which means a chunk of that readily available metal is already gone. Sprott Asset Management made a sharp observation here: consecutive years of deficit in a metal where end-users can't easily substitute creates a fundamentally different price environment than normal cyclical tightness. Why? Because the buyers absorbing the deficit are manufacturers who need the metal regardless of price - not speculative traders who'd bail on a pullback.
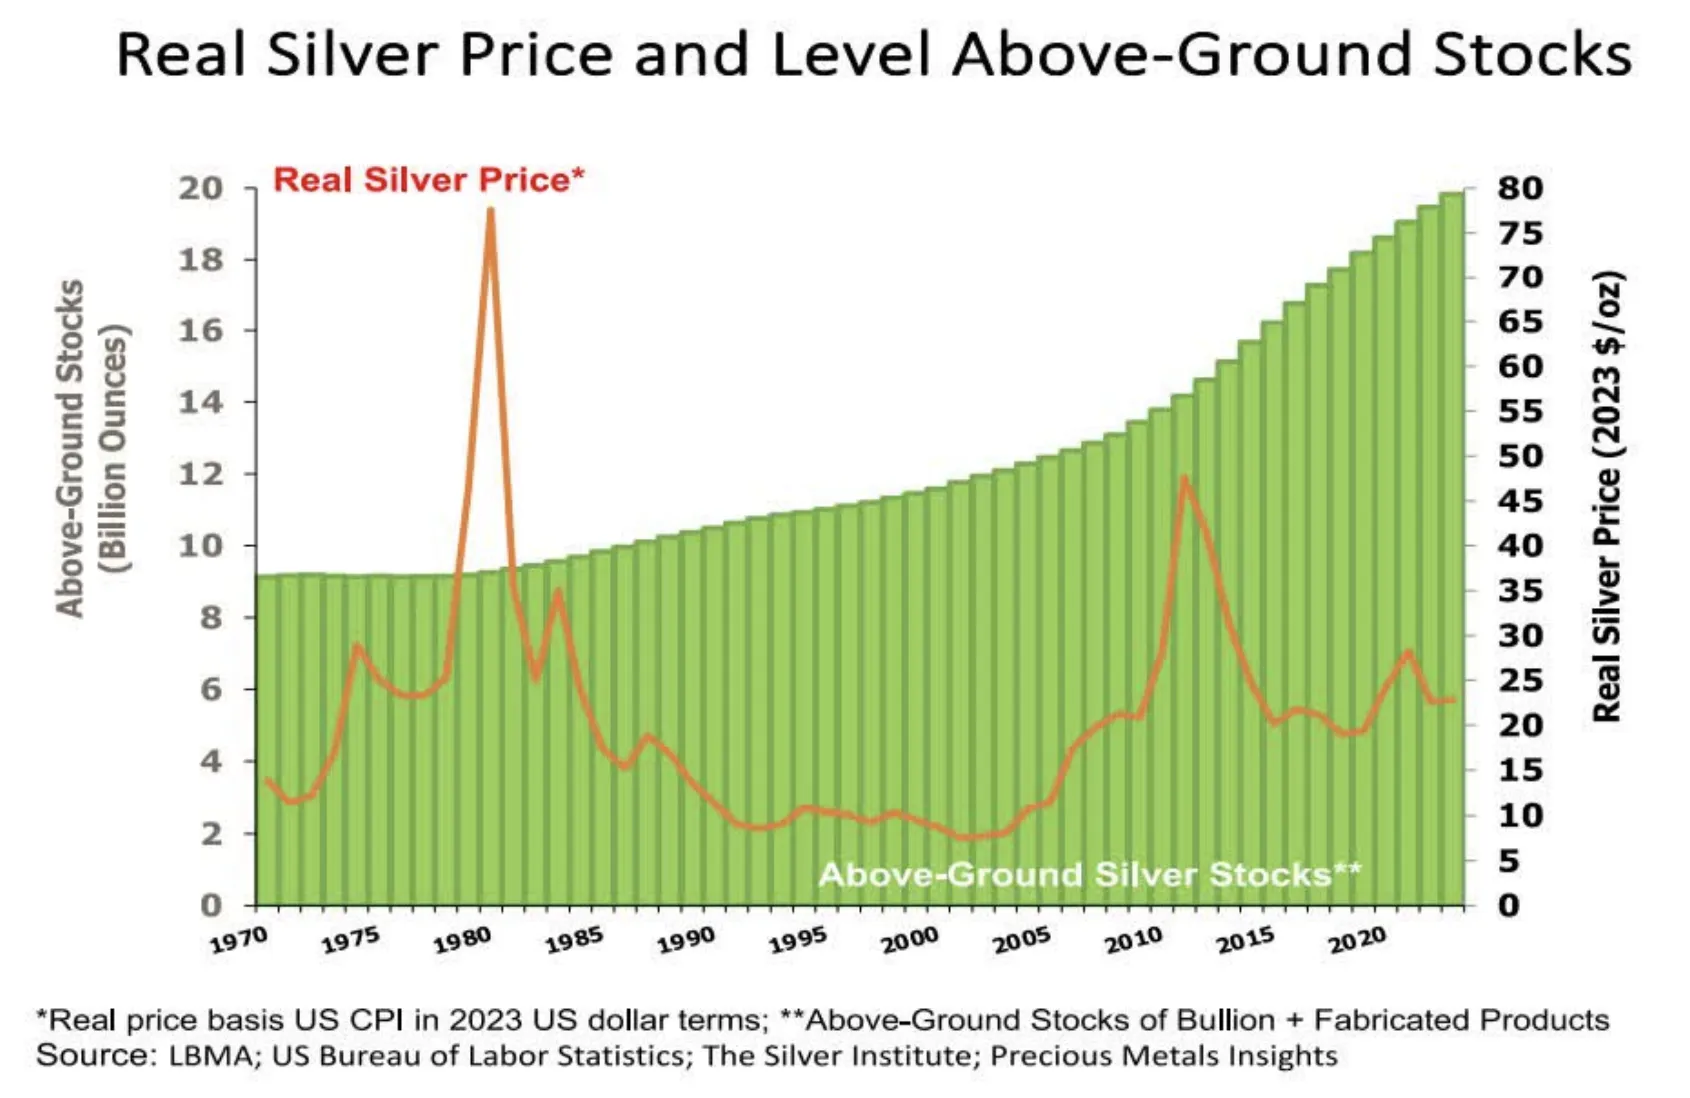
Real Silver Price and Above-Ground Stocks (IRMA, Silver Institute, Precious Metals Insights)
Silver is up more than 150% in twelve months and I think we're still early. That sounds crazy, and I get it. But the rapidly increasing industrial demand is putting pressure on paper market structures in ways that haven't happened in decades. The physical metal is driving prices now - not paper contracts, not futures positioning. Real demand for real metal. And that changes everything about how this market behaves going forward.
Key Takeaways
- Gold reached all-time highs of $4,568 amid Federal Reserve independence crisis and criminal investigation developments
- Silver outperformed with 4.54% gains to $83.58, extending twelve-month returns to 181.78%
- Technical analysis identifies $5,000 as gold's next major target (100% Fibonacci extension) with support at $4,360 and $4,255
- Silver targets $88 (161.8% Fibonacci extension) after achieving 150% gains in 2025 and 17% year-to-date in 2026
- Institutional forecasts cluster around $4,900-$5,300 for gold, with extreme scenarios suggesting $6,000+ under geopolitical stress
- Long-term silver predictions range from $200 to $500, though these represent aggressive scenarios beyond consensus estimates
- Distance between current prices and moving averages suggests potential vulnerability to corrections despite strong momentum
- Retail brokers responded with varied approaches including leverage adjustments and volatility warnings
- Industrial demand now accounts for ~60% of global silver demand, driven by AI, solar, and EV applications
- Solid-state batteries could add ~55 million ounces of silver demand at just 10% EV adoption
- Silver market has been in a supply deficit for several years, with above-ground stockpiles declining
Bellwether Research, Market Research, January 10, 2026