Long-duration Treasury bonds are, in most years, the least exciting asset class in a portfolio. They don't announce earnings beats, don't split their stock, and don't issue press releases about product launches. They simply reflect what the market believes about the future path of interest rates - and right now, that reflection shows a bond that has fallen 48% from its 2020 peak, resting at the floor forged by the most aggressive rate-hiking cycle since the early 1980s.
The iShares 20+ Year Treasury Bond ETF (TLT) is currently trading in the low $80s - a price range that has historically served as a structural floor. The fund holds U.S. government-backed bonds with maturities beyond 20 years, carries an effective duration of 16.13 years, and distributes income monthly. With each 1% decline in long-term interest rates, the fund's net asset value would be expected to rise approximately 16%, mechanically and predictably. That relationship between rate cuts and price appreciation is the central architecture of this analysis.
What makes the current setup compelling is not simply that yields are elevated - they are - but that the macro backdrop has shifted meaningfully toward a scenario where rates come down. Trade war escalation, slowing consumer sentiment, and rising recession probability estimates at major institutions are creating conditions historically associated with Fed pivots. We are not predicting when. We are observing that the asymmetry - a 4.5% yield while waiting, limited new downside from a structural floor, and double-digit price upside per rate-cut increment - is unusually well-aligned. This memo explains the framework behind that observation.
TLT is the largest and most liquid long-duration Treasury ETF in the world, managed by BlackRock's iShares division. With over $58 billion in assets under management, its daily trading volume routinely exceeds $3 billion - making it one of the most widely-tracked rate instruments available to retail and institutional investors alike. The fund provides exposure to U.S. Treasury bonds with 20+ years to maturity, though its effective duration (the more accurate sensitivity measure) sits at 16.13 years, reflecting the weighted average of its current portfolio.
The headline numbers don't tell you everything. A convexity of 3.53 sounds like a footnote - but it's actually a structural edge baked directly into the bond mathematics. When rates fall by 1%, TLT gains more than it loses from a 1% rise in the opposite direction. The asymmetry compounds in the holder's favour in any declining-rate environment. And the fund's negative option-adjusted spread confirms what the price history already shows: this is a flight-to-quality instrument. When credit risk spikes in equities, money moves into Treasuries. TLT doesn't just benefit from rate cuts - it benefits from market fear.
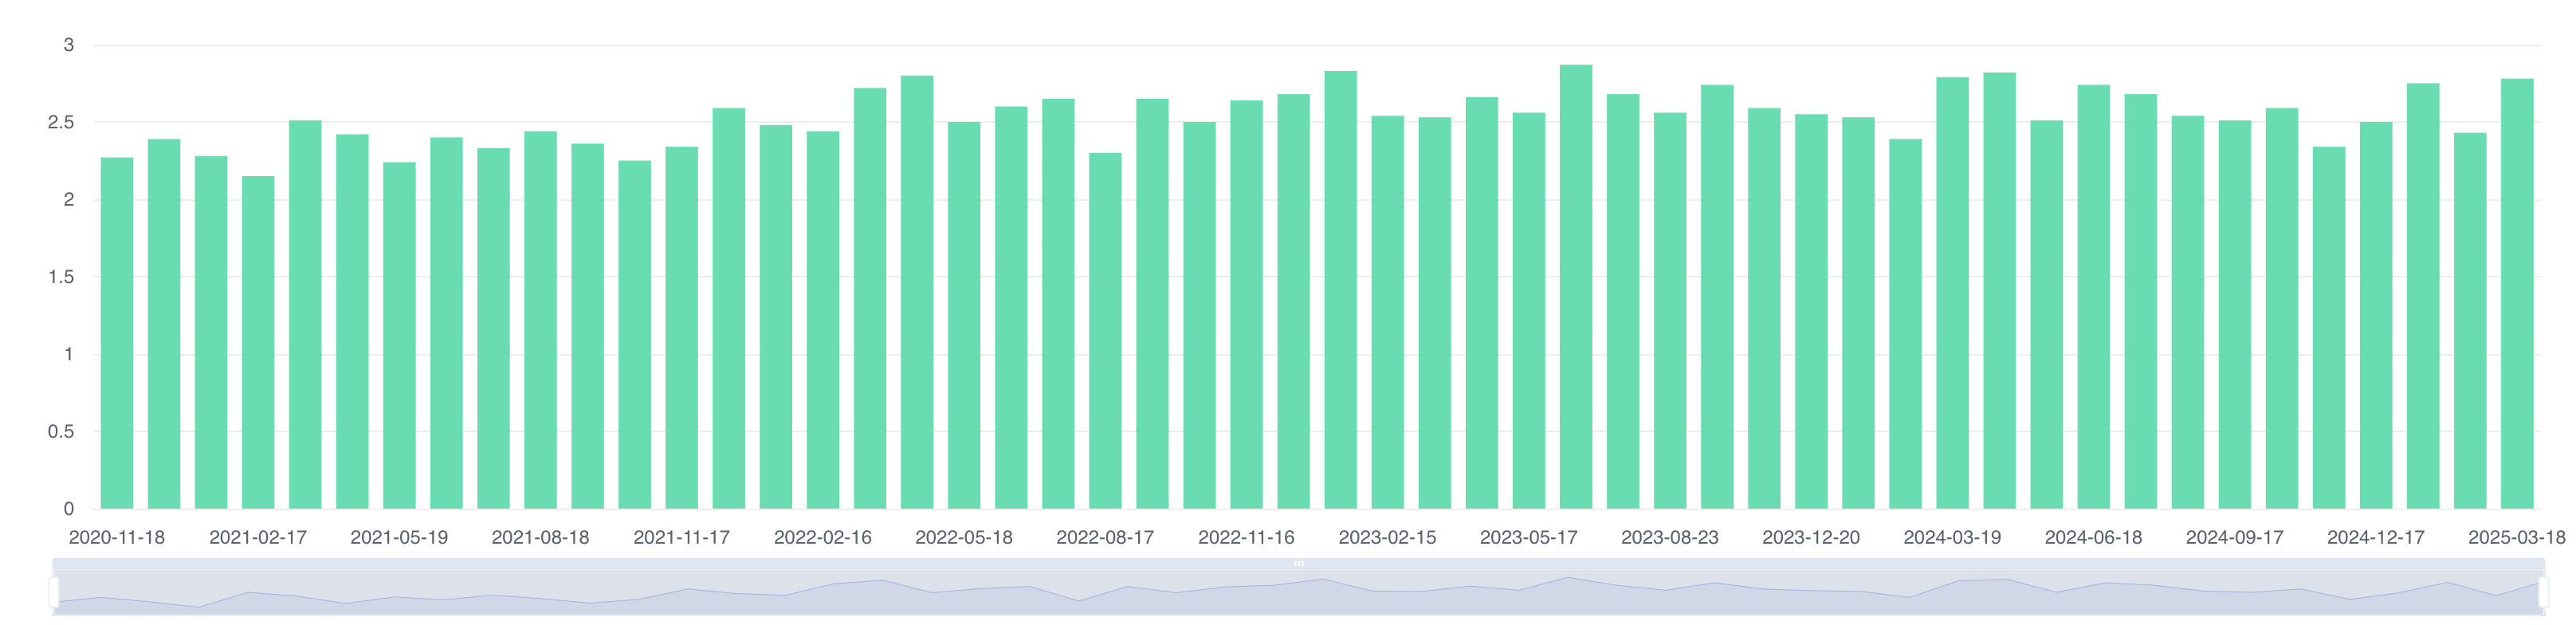
The fund's 0.15% expense ratio is one of the lowest in the fixed-income ETF universe. Compounded over ten years, total fee drag amounts to approximately 1.51% - a figure that becomes economically trivial when positioned against the magnitude of potential capital appreciation in a rate-cutting cycle. Monthly distributions further improve the practical proposition: income is returned to investors every calendar month, reducing liquidity risk compared to quarterly or semi-annual structures. Since inception in 2002, TLT's income component has come predominantly from coupon income rather than capital gain distributions - a stable, predictable structure that does not depend on market timing.
The 2025 macro environment for long-duration bonds is genuinely contested. Two arguments are in play simultaneously - neither is fantasy, both are grounded in real economic dynamics. Which one wins is what drives TLT's price path. Neither gets to be dismissed.
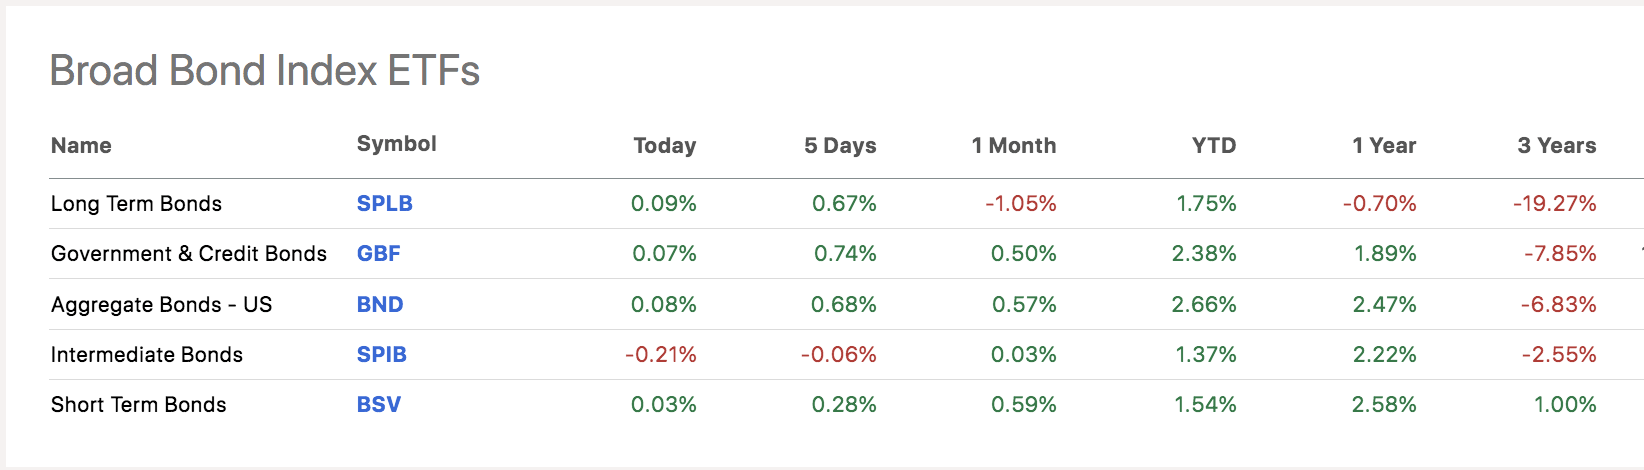
Both forces are real. But they don't resolve on the same clock. Tariff-driven inflation is largely a short-term supply shock - most historical episodes of tariff-related price spikes moderate within 12–18 months as supply chains adjust or demand softens. Recession risk, on the other hand, compounds: each month of elevated uncertainty tends to deepen it. The bond market is beginning to price this sequencing - yields on the 16–20 year segment remain pent-up relative to the short end, giving investors the opportunity to lock in current yields before the market fully reprices for a slowdown. The U.S. yield curve flattened materially in the month following the tariff announcement, and an inversion or further flattening would reinforce the recession thesis.
There is a widely-repeated view that investors should wait for a yield curve inversion before entering TLT. The logic is intuitive: an inverted yield curve signals recession, recessions cause rate cuts, and rate cuts lift long bonds. Follow the chain. But when tested empirically against TLT's actual price history, the signal fails as a timing tool in a meaningful way - and understanding why is important for framing the current entry rationale.
TLT has existed since 2002, which allows for a three-event sample across yield curve inversions. The results are instructive:
| Inversion Date | Recession Declared | Lag (Months) | TLT After Inversion | TLT Breakout Trigger |
|---|---|---|---|---|
| December 27, 2005 | Late 2007 | ~23 months | Lost ~10% initially | Recession announcement |
| August 27, 2019 | Early 2020 | ~5 months | Flat then rallied late 2019 | Recession announcement |
| April 1, 2022 | Not yet declared | Ongoing (>30 mo) | Entered a bear phase | Still awaiting signal |
All three cases point to the same thing: the primary price signal for TLT is not the yield curve inversion itself - it is the official recession announcement. TLT does not rally at the time of inversion; it tends to wait until the economic deterioration is formally acknowledged. But that creates a practical problem: no investor - not even the Federal Reserve - can know precisely when a recession will be declared. Waiting for the announcement risks missing a significant portion of the move, as TLT front-runs the formal declaration by 1–3 months in most cases. The 2022 inversion represents a cautionary tale: it has become one of the longest-lasting inversions in recorded history without a recession following - rendering the inversion signal itself unreliable as a standalone indicator.