Most of the market tips we write are about companies - businesses with earnings, moats, management teams, and narratives that can shift. This one is different. JEPQ isn't a company. It's a strategy. And like any strategy, what matters isn't whether the instrument works in the abstract - it's whether the moment is right. Right now, it is.
The Nasdaq-100 had an exceptional year. AI spending exploded, the hyperscalers reported strong numbers, and the index climbed relentlessly from its April 2025 lows near $44 on QQQ. But as we sit here at year-end, cracks are beginning to show. The competitive intensity among the Magnificent Seven has never been higher - Google, Microsoft, Meta, and Amazon are collectively committing to nearly $700 billion in AI capital expenditure in 2026, a figure that would have seemed fantastical three years ago. Markets are starting to ask whether returns will justify the spend. That question alone is enough to make 2026 choppier than 2024.
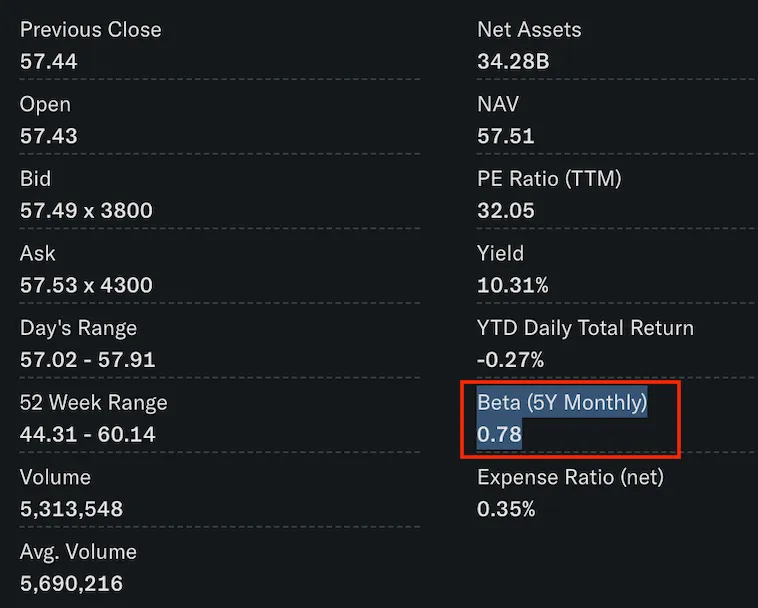
Choppy markets, as it happens, are exactly where JEPQ earns its keep. The fund sells out-of-the-money covered calls on the Nasdaq-100 every month, collecting premium income regardless of which direction the index drifts. At $57 today, that premium translates to a trailing yield of roughly 10.3% - $5.88 per share per year, paid monthly - while keeping most of the downside buffer that comes with 107 carefully selected Nasdaq names. Entry zone $XX–$XX. Target $XX–$XX over 9–12 months.
Before making any case for the trade, it's worth being precise about what JEPQ is and - just as important - what it isn't. This distinction matters more than it does for a typical stock tip, because covered call ETFs are widely misunderstood by retail investors who either treat them as bond substitutes or dismiss them entirely as "return-capped."
The upside cap criticism is real but often overstated. Investors who bought QQQ through 2023–2024 would have collected every percentage point of a 50%+ bull run. JEPQ would have clipped some of that. Fair. But that scenario - a multi-year rip with few corrections - is precisely the environment where covered calls underperform. The question is whether we're entering that kind of market in 2026, or something altogether choppier.
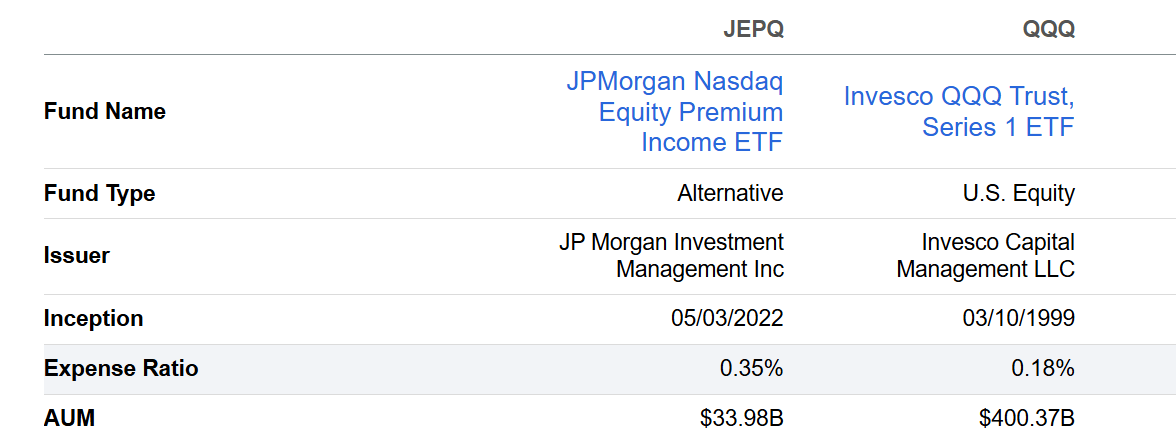
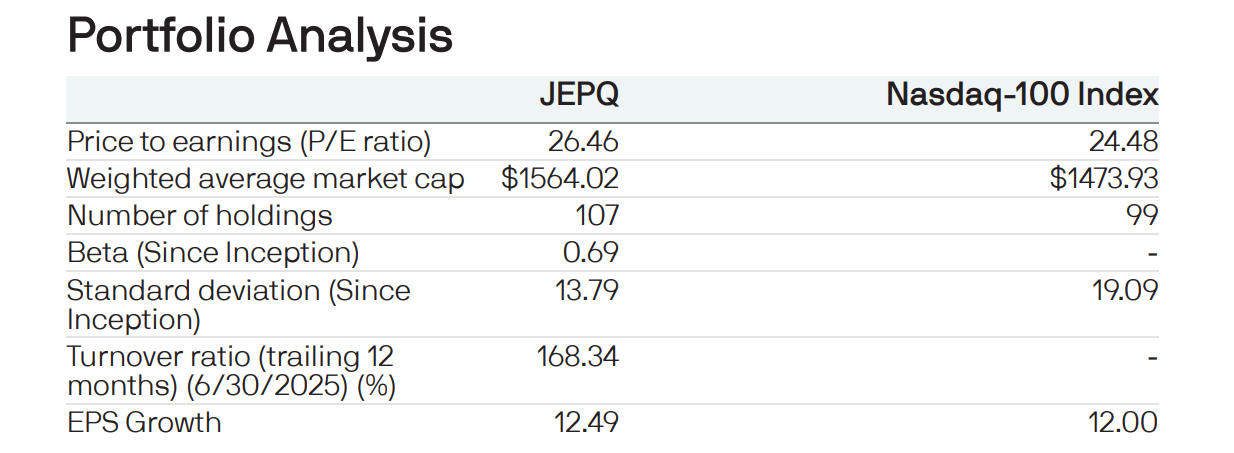
JEPQ's equity sleeve holds 107 names - a mix of Nasdaq-100 positions with a few off-benchmark holdings permitted up to 20% of NAV. In practice, the top 10 holdings look almost identical to QQQ. The differences are in the weights. JEPQ's model underweights the most volatile, most richly valued names while still capturing most of any Nasdaq upside.
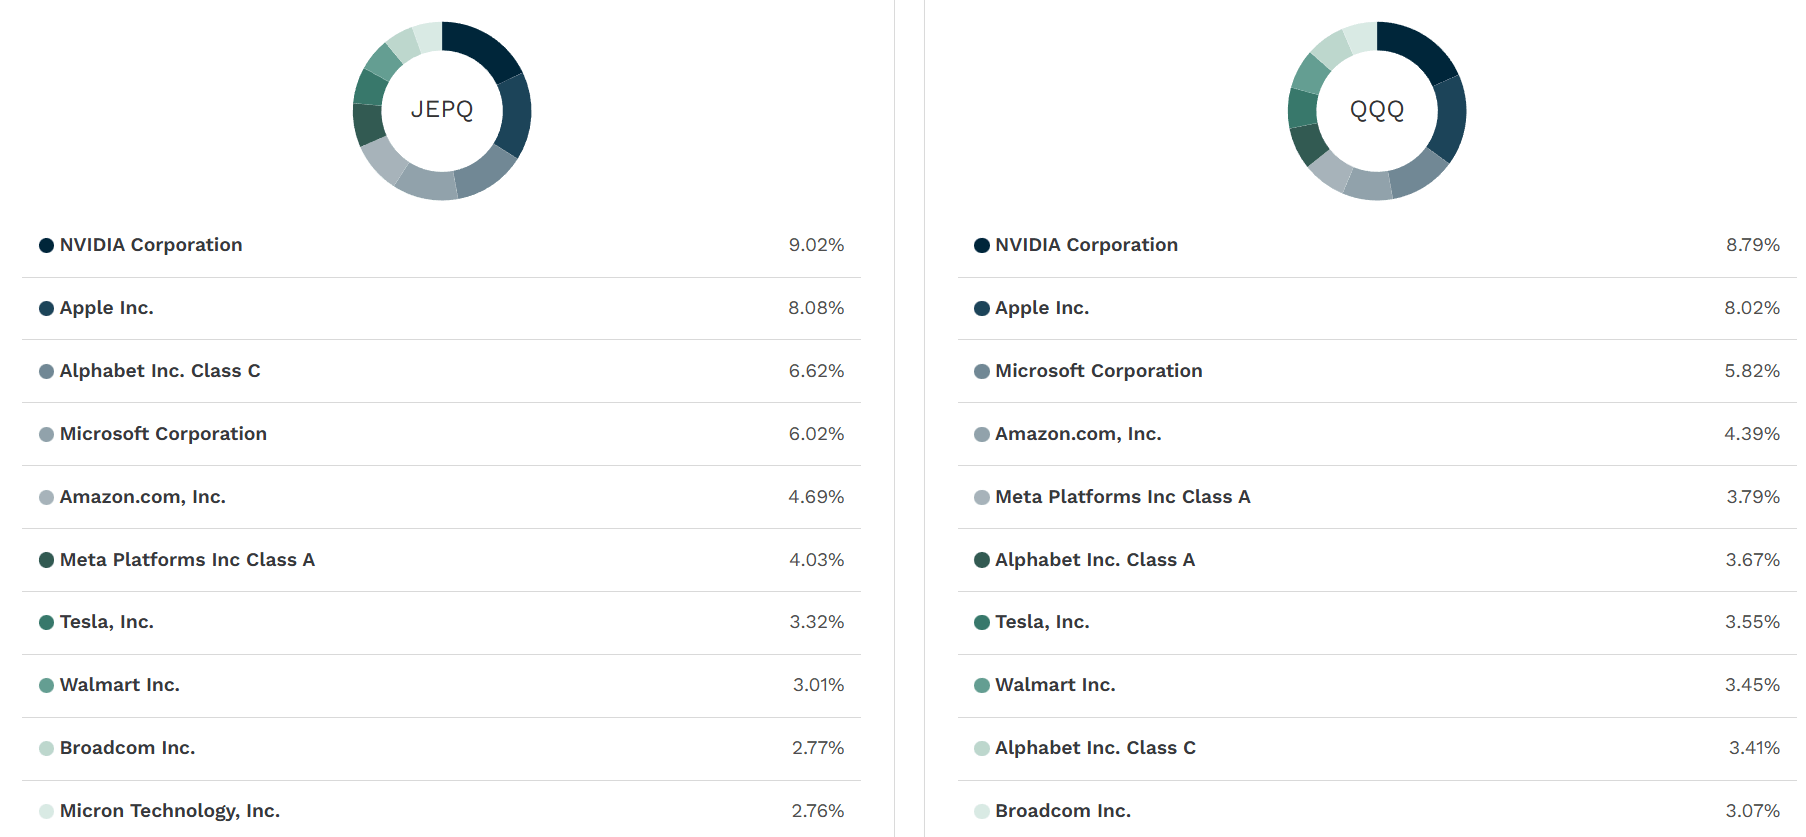
Something worth pausing on in this holdings comparison. JEPQ's quantitative selection tends to underweight the names with the highest valuations and the greatest sensitivity to AI spending narratives - exactly the names that drove QQQ's 2024 outperformance but now carry the most execution risk as CAPEX commitments balloon. Heading into 2026 with $700B in industry AI spend planned, a portfolio that's slightly less dependent on those names isn't a bug. It's a feature.