The legitimacy debate is over. It ended - quietly, almost anticlimactically - the day the SEC, BlackRock, and the U.S. Treasury decided to join the party rather than shut it down. Done. Nobody credible wastes breath on that anymore. But here is what replaced it, and I think this question is actually harder: can Bitcoin function as digital gold inside institutional portfolios on a sustained, multi-cycle basis? Or does the volatility profile that defined its first decade just keep creeping back every time the suits settle in and get comfortable?
Three developments over the past 18 months have genuinely caught my attention above the noise. Spot Bitcoin ETFs got the green light in the U.S. and immediately started hoovering up coins at a pace that surprised everyone - even the most caffeinated permabulls didn't model this kind of absorption rate. The April 2024 halving slashed new issuance to 3.125 BTC per block, right on schedule. And institutional participation crossed some invisible threshold from polite exploration into what looks (and I want to be careful with this word) structurally different from anything prior cycles offered. Stack those three things on top of each other and Bitcoin is trading more like a macro instrument than a casino chip. The transition was sloppy. But it happened.
What follows is a systematic walk through Bitcoin as market infrastructure - supply mechanics, who's actually buying and why they're doing it, on-chain health indicators, the macro and regulatory backdrop, and a forward-looking scenario framework. One question runs through all of it: does the data genuinely support the store-of-value thesis, or is structural risk still being underpriced by people who fell in love with the narrative?
1 Origins and Evolution
Fifteen years. That is all the time it took to go from a cryptographic toy bouncing between cypherpunks on mailing lists most people have never heard of, to a multi-trillion-dollar asset sitting in sovereign wealth fund portfolios alongside U.S. Treasuries. And the path there looked nothing like a straight line - more like a drunk walk up a mountain that kept rearranging its topography. Each phase depended on the mess before it, though. The custody infrastructure cobbled together during crypto winter is what made institutional entry even thinkable, and that institutional momentum is what made the ETF approval (eventually, grudgingly) feel less like an "if" and more like a "when."
2 Supply Economics and Emission
Here is what separates Bitcoin from literally every other financial instrument I can think of. A mathematically enforced hard cap. A disinflationary emission schedule that ticks down like clockwork, indifferent to politics or market panics or what any central banker happens to feel about it on a given morning. Predictable supply shocks every four years. You can debate whether it's being priced correctly - go ahead, reasonable people do - but you can't change the code. The code doesn't care about your opinion.
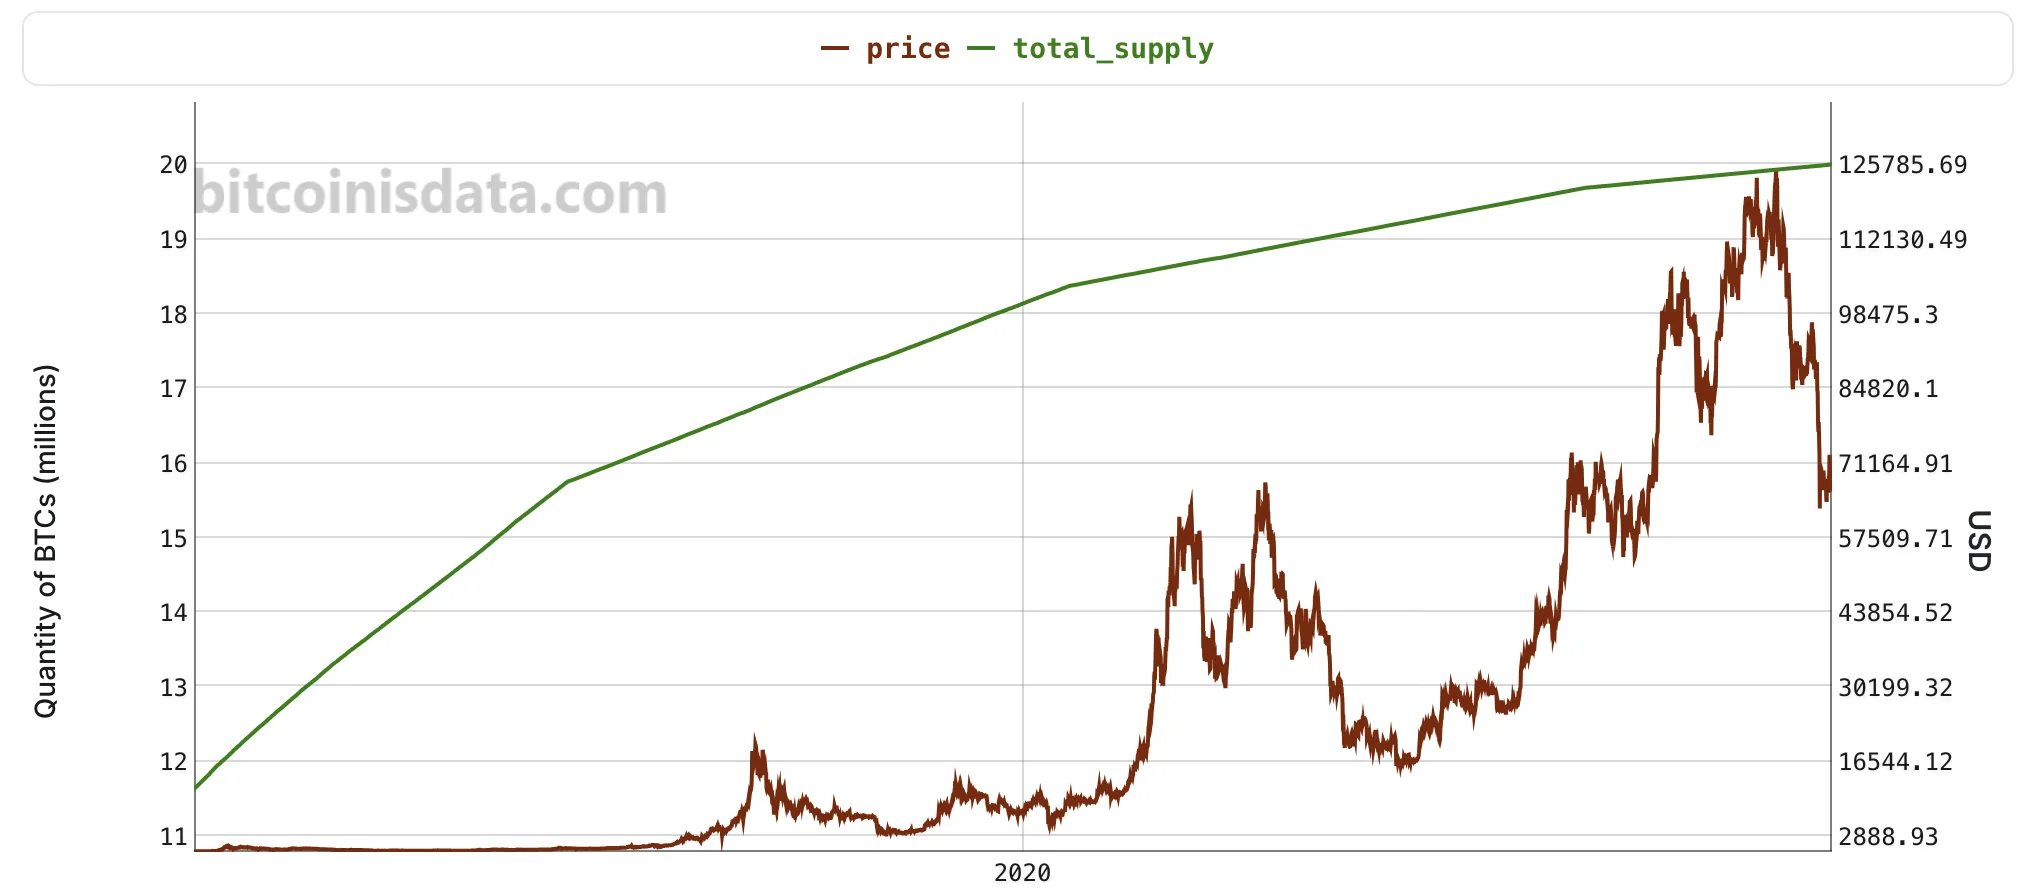
The 21 million cap isn't some marketing gimmick. It's baked into protocol code since 2009 and altering it would require consensus from the entire network - which, if you have ever tried to get three friends to agree on where to eat dinner, you know is functionally impossible at this scale. As of 2025, over 19.7 million BTC have been mined. That is 94% of the total supply already out the door. The remaining 6% trickles out on a declining schedule until roughly 2140, at which point block rewards hit zero and miners live or die on transaction fees alone. Whether that economic model actually sustains itself a century from now? Fair question. Legitimate concern, even. But frankly it is a problem for analysts in 2090 to lose sleep over, not us.
And then there are the coins that are simply gone. Glassnode and Chainalysis peg the number at 3-4 million BTC permanently inaccessible - lost private keys, early wallets belonging to people who died or forgot a password they scribbled on a napkin in 2011, coins sent to addresses that will never, ever transact again. That is more than 15% of total supply. Just vanished into the ether. (I realize the irony of using that word in a Bitcoin article.) On top of that, over 70% of circulating supply hasn't budged in more than a year. So what is actually available to trade on a random Tuesday afternoon? A remarkably thin slice of the headline 19.7 million number. The market is structurally tighter than anyone realizes when they're just glancing at the round figures and moving on.
3 Demand: Drivers and Segments
The demand picture this cycle? Nothing like 2017. And honestly, nothing like 2021 either. Back then it was retail frenzy amplified by leverage ratios that should have been illegal (and in some jurisdictions now are). Today the buyer mix has shifted in ways that matter: institutional flows through regulated ETFs, a long-term retail cohort that has proven it will not sell, macro overlay from global liquidity conditions, and miner economics creating periodic overhead supply. Way more segmented. Way more structurally anchored. And that is changing how corrections play out - shallower, faster recoveries than the old cycle playbook would have you expect.
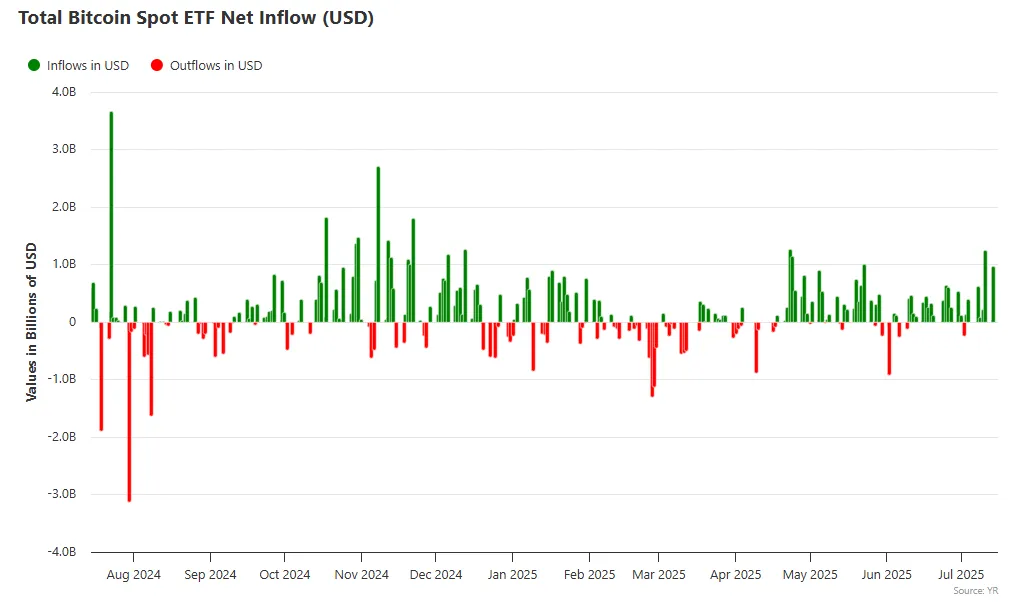
January 2024 rewrote the demand math. Permanently, I think. BlackRock's IBIT alone holds approximately 661,457 BTC - roughly 3.15% of total supply, all parked in regulated custody with Coinbase. Throw in Fidelity, Ark, VanEck, and Franklin Templeton and you're above 900,000 coins locked inside ETF structures. But here's the thing most people miss about that number, and it took me a while to fully appreciate it too: these are not trading positions. The ETF wrapper doesn't panic-sell because sentiment wobbled on a Thursday morning. Coins go into custody. They sit there. They only re-enter the market if institutions themselves decide to redeem shares, which is a fundamentally higher bar than some retail trader hitting the sell button because he saw a scary headline on X. The friction is different. The holding behavior is different. And that changes the available float in ways that aren't showing up in most people's models yet.
Retail is telling the same story, from a different angle. Over 70% of BTC hasn't moved in more than a year. The HODLer base has become Bitcoin's structural price floor, and what separates this cycle from prior ones is that these holders aren't leveraged to their eyeballs. They're not getting margin-called into panic selling at 3 AM. They just hold. Bloomberg flagged record ETF inflows in May 2025 coinciding with measurable gold outflows - the first clear quantitative evidence of a rotation that gold bugs had been denying for years. Is that rotation permanent? I'm genuinely not sure. But it is the kind of data point you sit with for a while before dismissing, especially if you're trying to figure out whether Bitcoin is carving real, durable space inside macro allocation frameworks or just renting it temporarily.
4 On-Chain Metrics
Price is a lagging indicator. Nobody wants to hear that - it feels wrong because price is right there on the screen, flashing at you - but it is. On-chain data shows you what's actually happening on the network before the price catches up. Or doesn't. Transaction frequency, economic value moving through the pipes, unique wallets active on any given day. These aren't abstractions. They are the ground truth that tells you whether a network is being genuinely used or just being priced by people who haven't opened a block explorer in months.
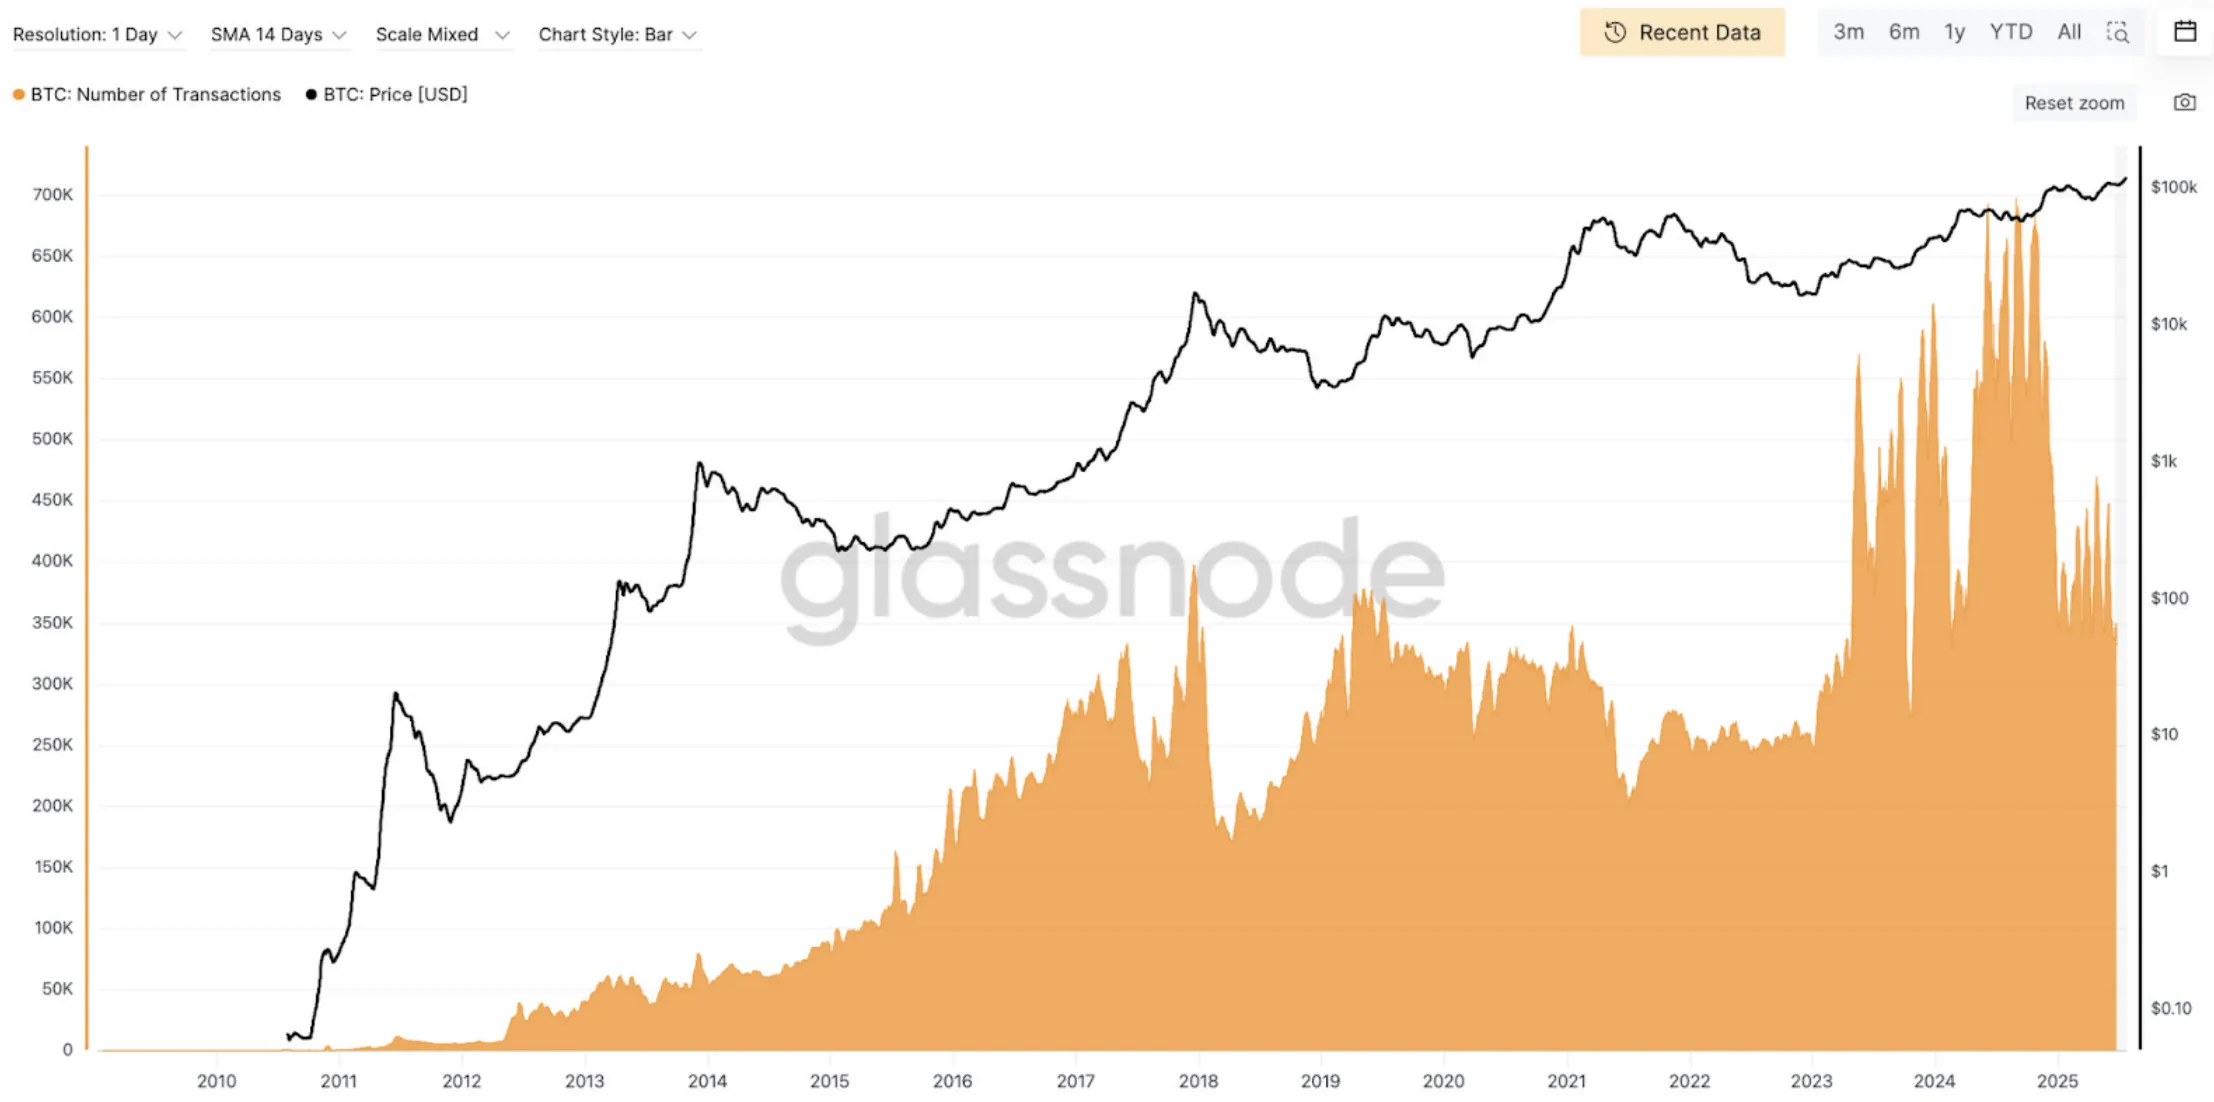
Transaction count. The most direct utilization measure there is - how often is the blockchain actually doing something? Sustained growth here means demand for block space is real, not performative. And that matters enormously for the security budget going forward, because miners need fee revenue to stay economically rational once block rewards compress toward zero. A sustained decline in transaction count? That is a problem you cannot hand-wave away. For a network whose entire value proposition rests on being an unbreakable settlement layer, usage is not cosmetic. It's load-bearing.
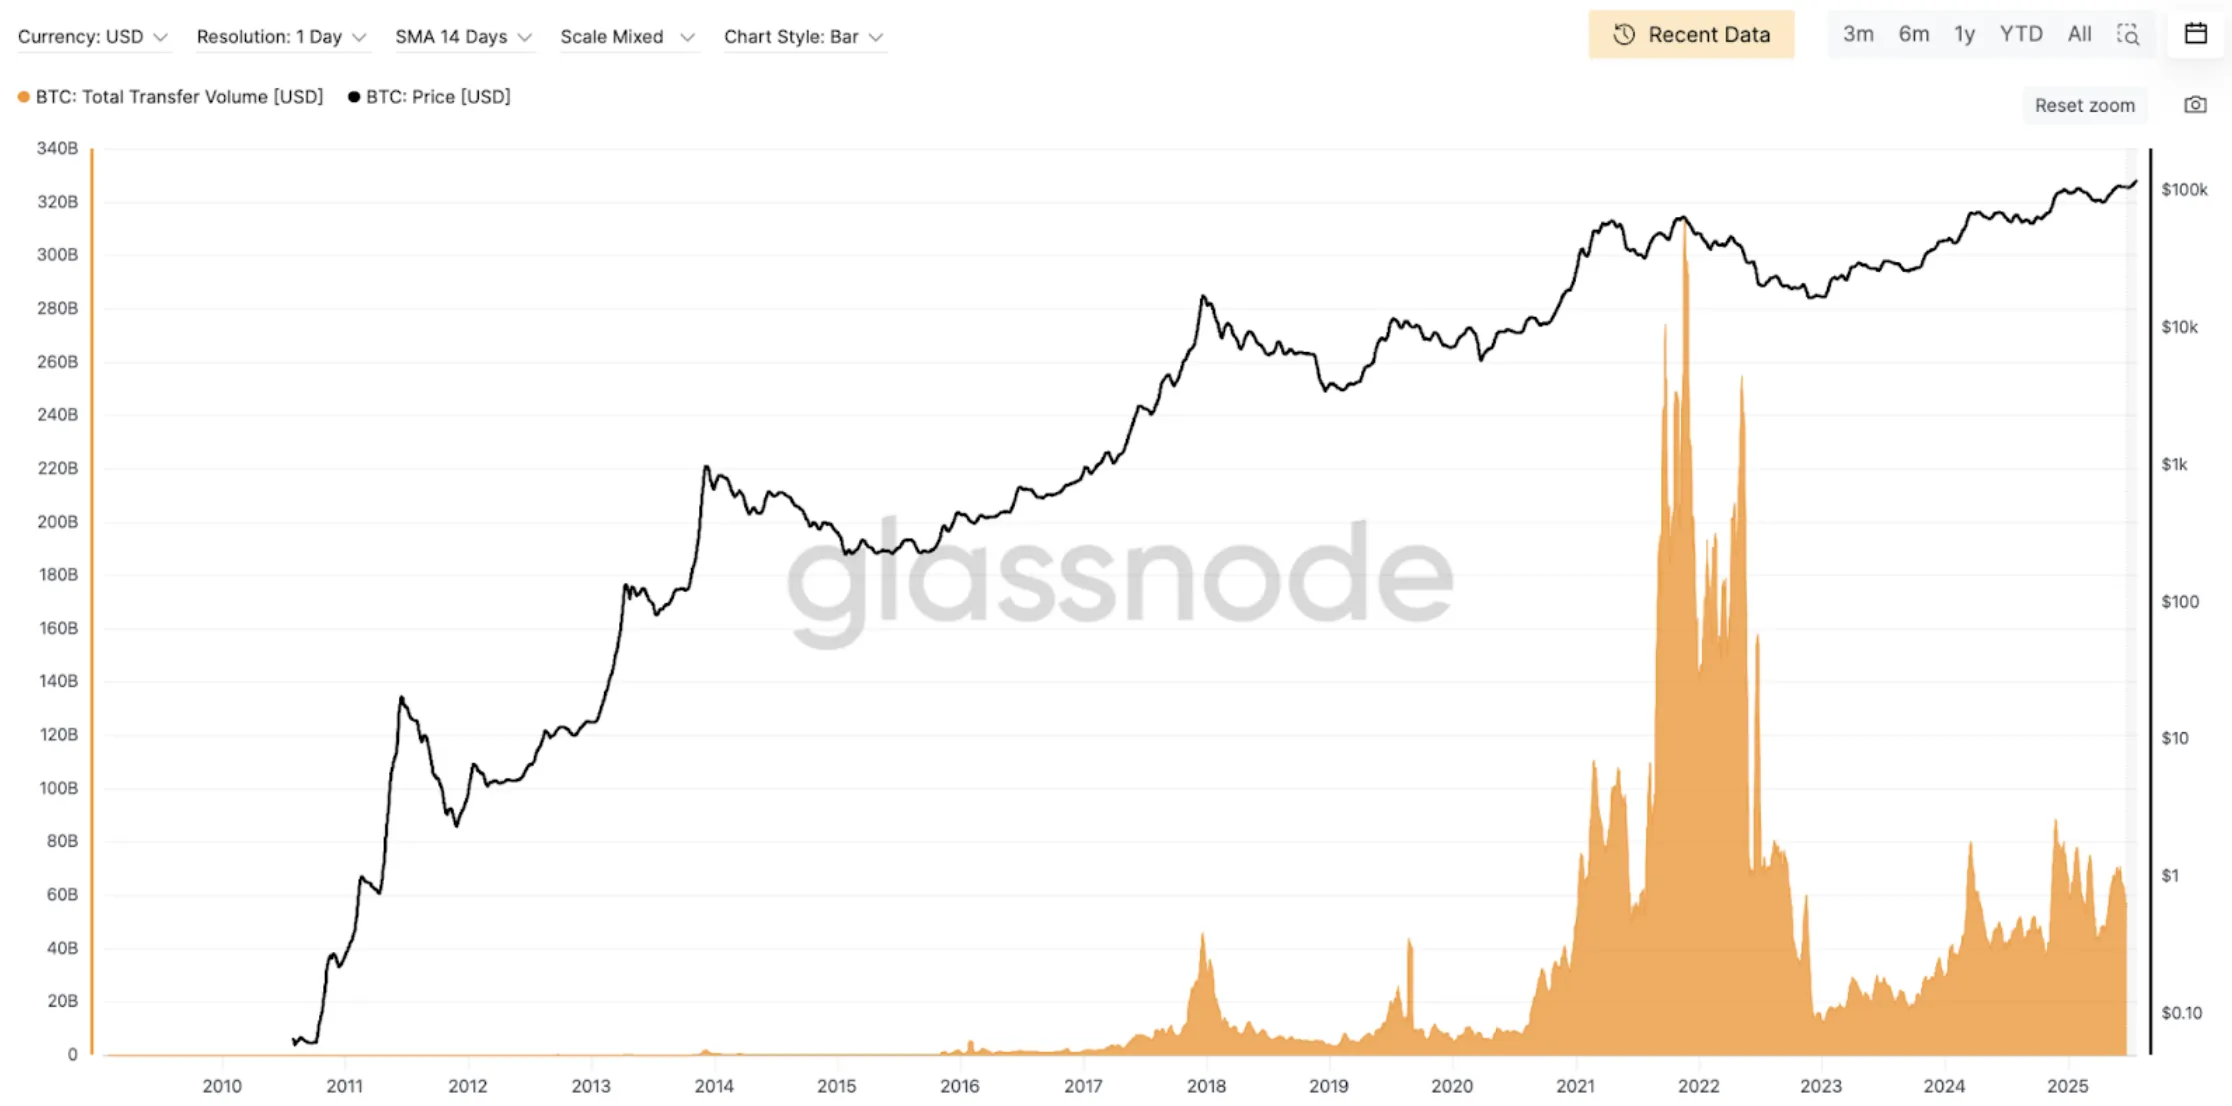
Transaction count tells you frequency. Transfer volume tells you weight. And the distinction matters, because one $500 million institutional settlement carries wildly more signal than 10,000 small peer-to-peer transfers - different animals entirely. When large-ticket on-chain volume rises, that's Bitcoin doing its job as settlement infrastructure for serious counterparties, not speculators flipping fractions of a coin while waiting for the bus. In 2025, average daily transfer volume ran $6-10 billion, roughly 30-40% below the 2021 peaks. Sounds bearish on its face, right? But hold on. A huge chunk of that migration has gone to ETFs, centralized exchanges, and Lightning. Which is exactly what a maturing ecosystem looks like when it's building proper off-ramps and second layers. Not a declining network. An evolving one.
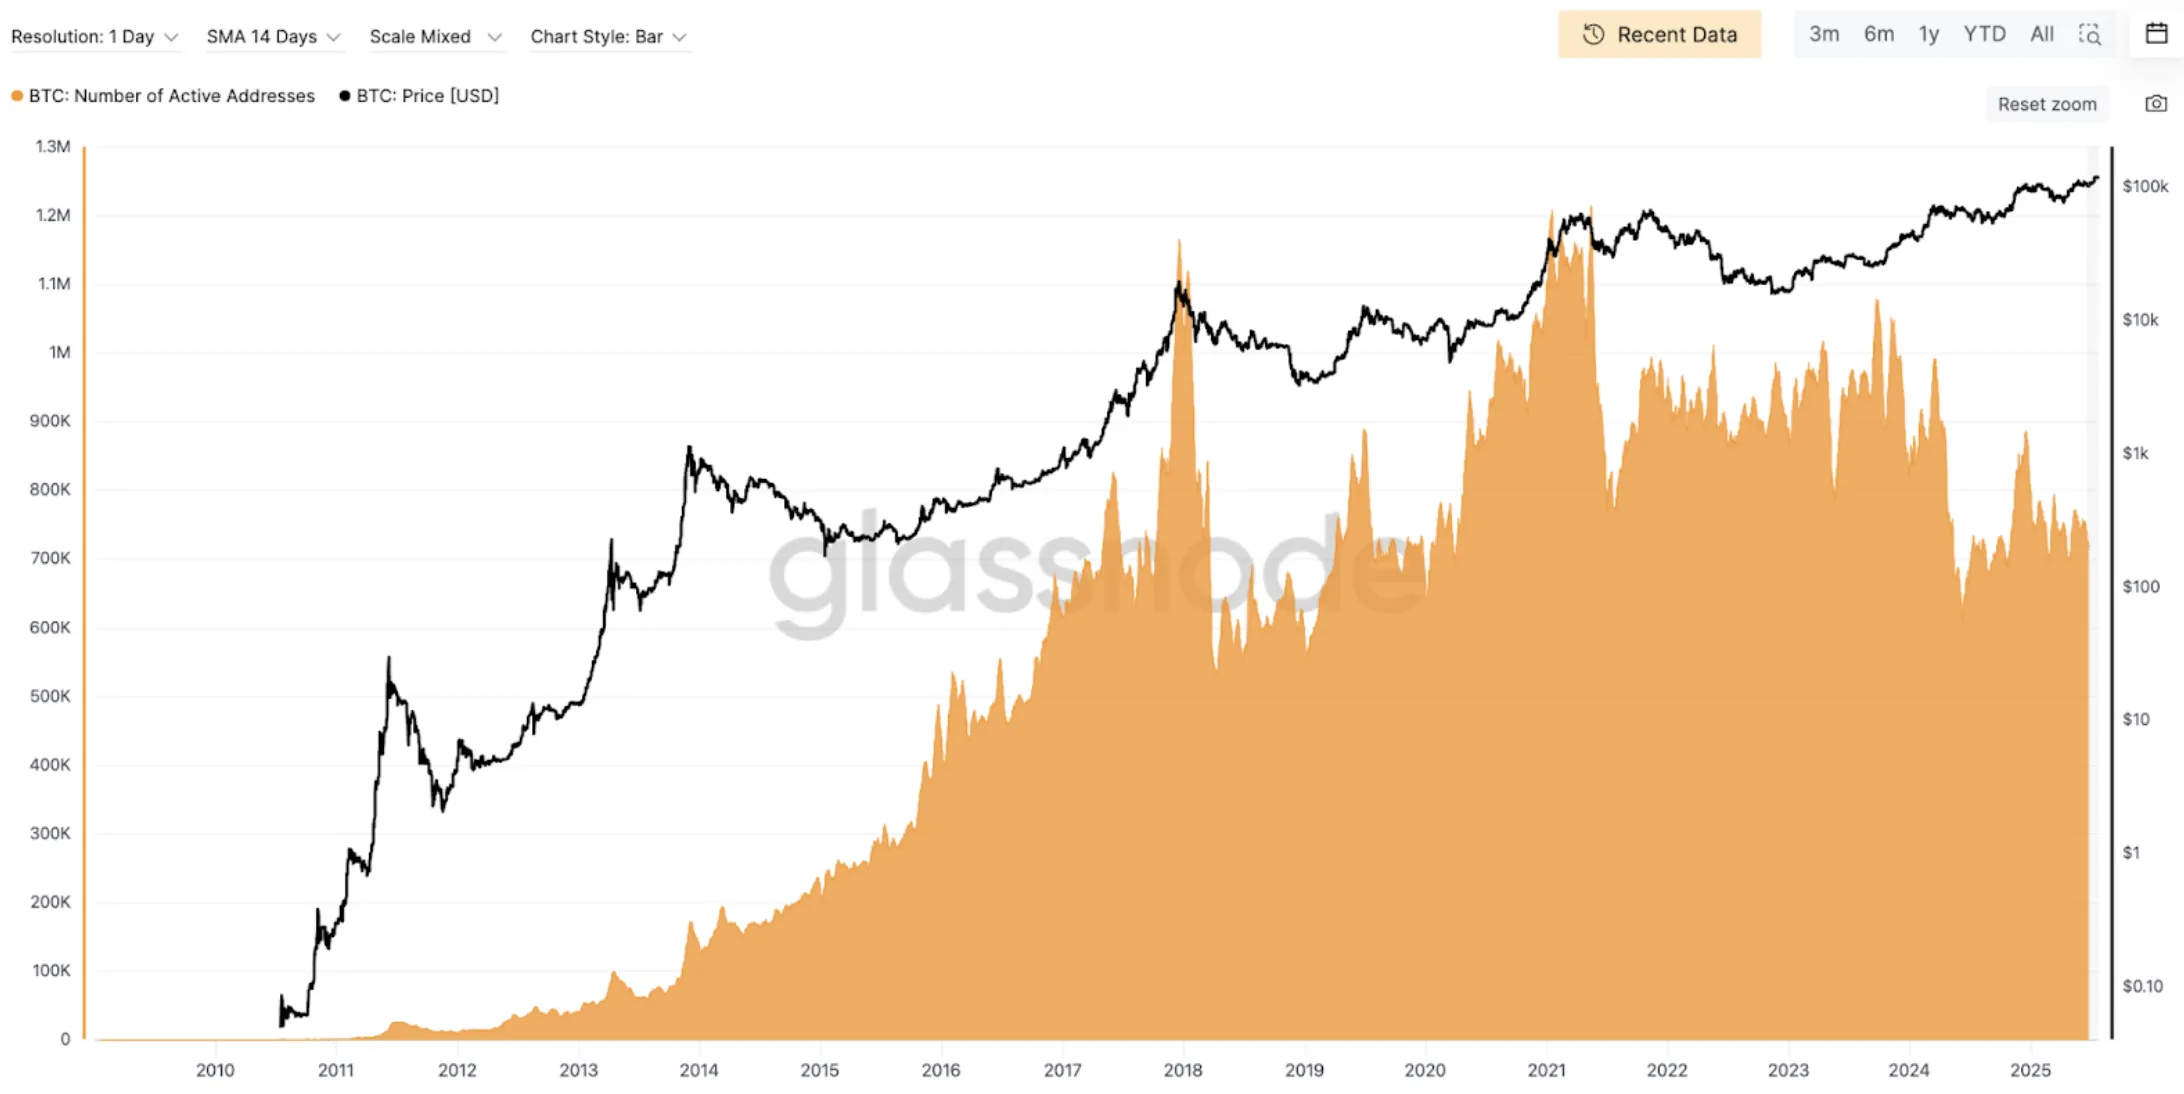
Active addresses measure breadth - how many unique wallets actually moved BTC on a given day. In 2025 that number stabilized around 800K-1M, roughly in line with 2020-2021 levels. New address creation cooled off after the ETF-launch spike in early 2024, and a lot of commentators flagged that as bearish. I'm not so sure. The interpretation matters way more than the headline number here. The slowdown isn't apathy. It's coins migrating into cold storage where they don't generate daily transaction signals. Think about what that means: an engaged HODLer who touches their wallet once a year looks identical, in this metric, to a completely inactive address. Conflating those two situations is how you get the analysis wrong.
5 On-Chain Sentiment Indicators
Raw network activity data tells you how much Bitcoin is being used. Good - necessary, even. But the next set of indicators answers a different question entirely: where are we in the cycle? What's the collective unrealized profit sitting across every wallet on the network? Are coins changing hands today coming from profit or from loss? How does the market's sticker price compare to what everyone actually paid? These tools cut through the price noise and hand you actual cycle context on a silver platter. Or at least, as close to a silver platter as crypto analytics gets.
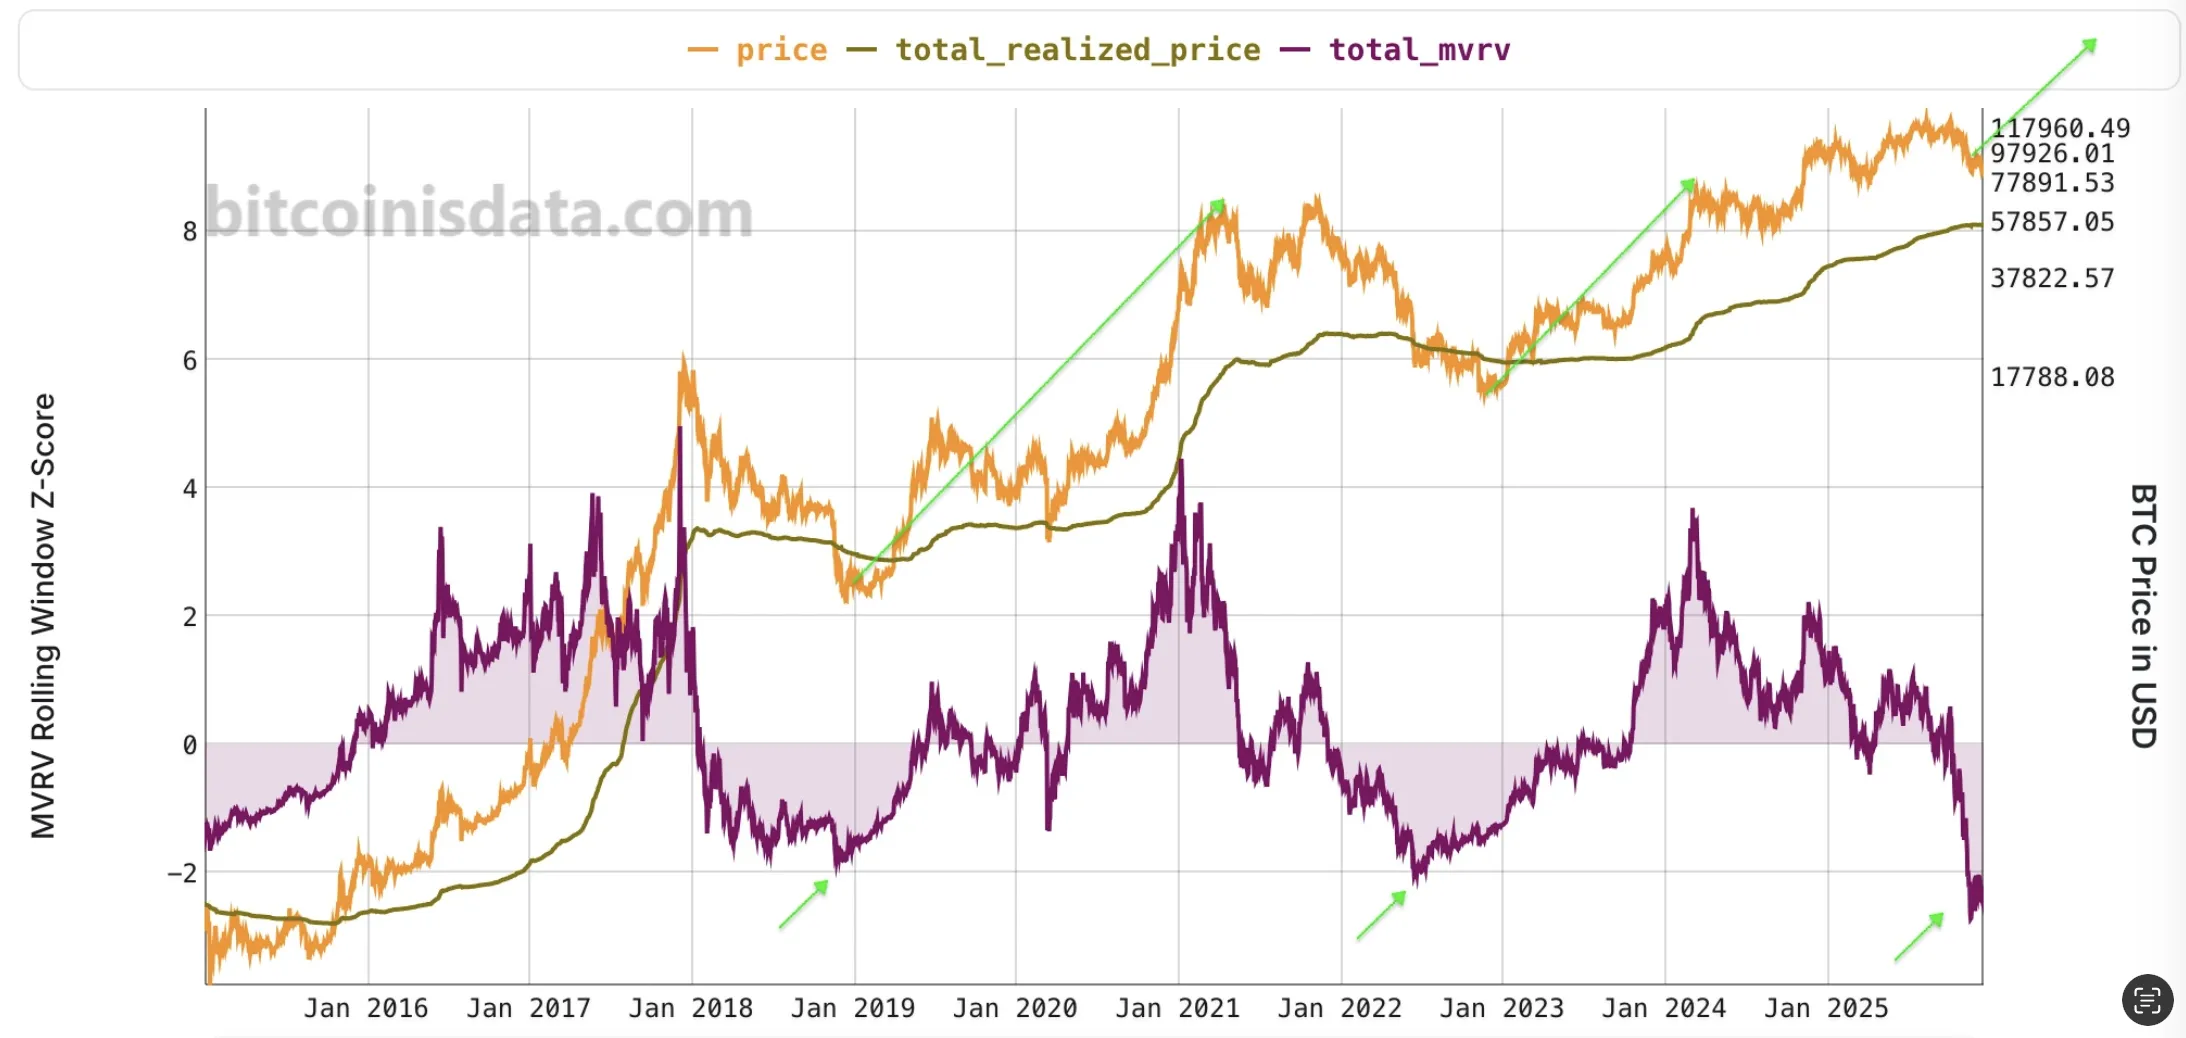
Think of the MVRV-Z Score as a valuation multiple for the entire network. You take market cap, divide by realized cap (which values every coin at the price it last moved - essentially the network's aggregate cost basis), then normalize the ratio by its historical standard deviation. What drops out is a reading of where current valuations sit in statistical context against every prior cycle. Not absolute numbers drifting in space. Context. Above 7 has marked major tops with almost eerie consistency. Below -0.5? Those have been the generational entry points - the kind where five years later you're kicking yourself for hesitating even a single week. In the current cycle the score hasn't sniffed either extreme, which either means we're sitting in a structurally rational range that institutional maturation has created, or the whole pattern is just playing out more slowly than the chart-matchers had penciled in.
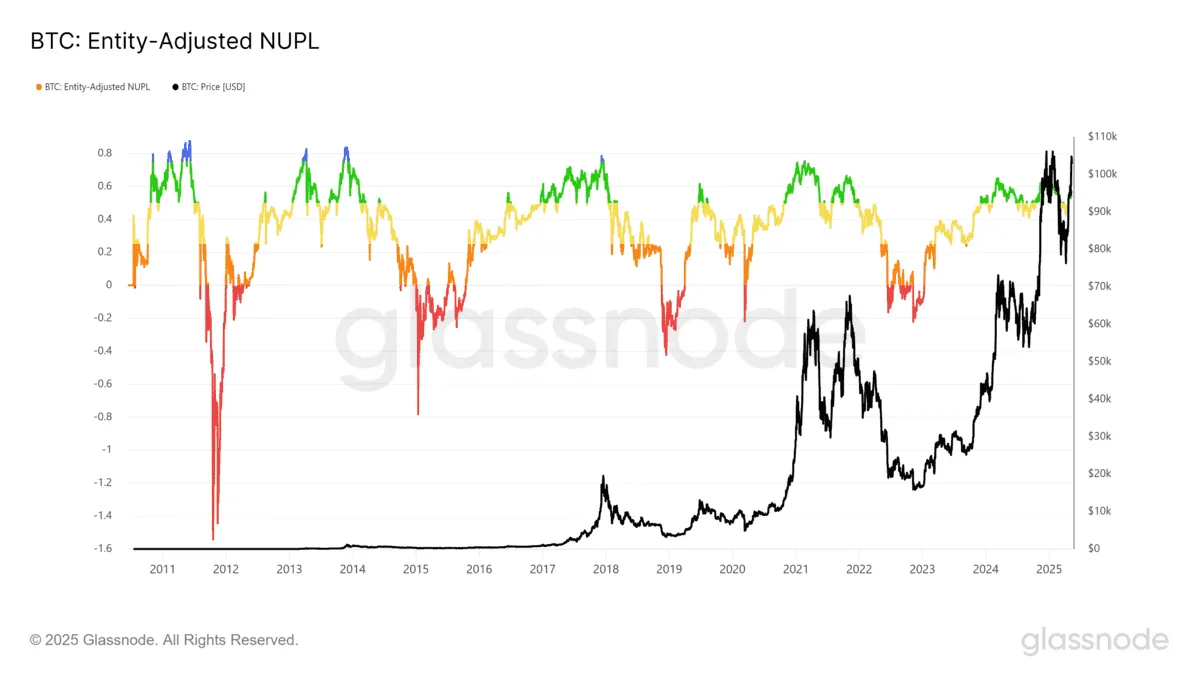
NUPL does something deceptively simple. Subtract realized cap from market cap. Divide by market cap. What you get is the aggregate unrealized gain or loss of every single Bitcoin holder, expressed as a percentage of total market value. One number. The whole market's emotional temperature, compressed into a decimal. When it climbs above 0.7, most participants are sitting on fat profits - and the market doesn't need bad news at that point to start selling. It just needs enough people in enough profit that trimming positions feels rational. Prudent, even. Which is, of course, precisely what the data tends to show right before the floor drops out.
The flip side is equally useful, maybe more so. Sustained negative NUPL - meaning the average holder is underwater - has reliably marked Bitcoin's most durable bottoms. By that point the forced selling is mostly exhausted. People who were going to capitulate already did. What remains is a base of holders who sat through a 50%+ drawdown and didn't flinch. NUPL won't hand you the exact day to buy, no indicator does. But as a read on broad market psychology across every wallet on the chain? Frankly, I've found very few tools that come close.
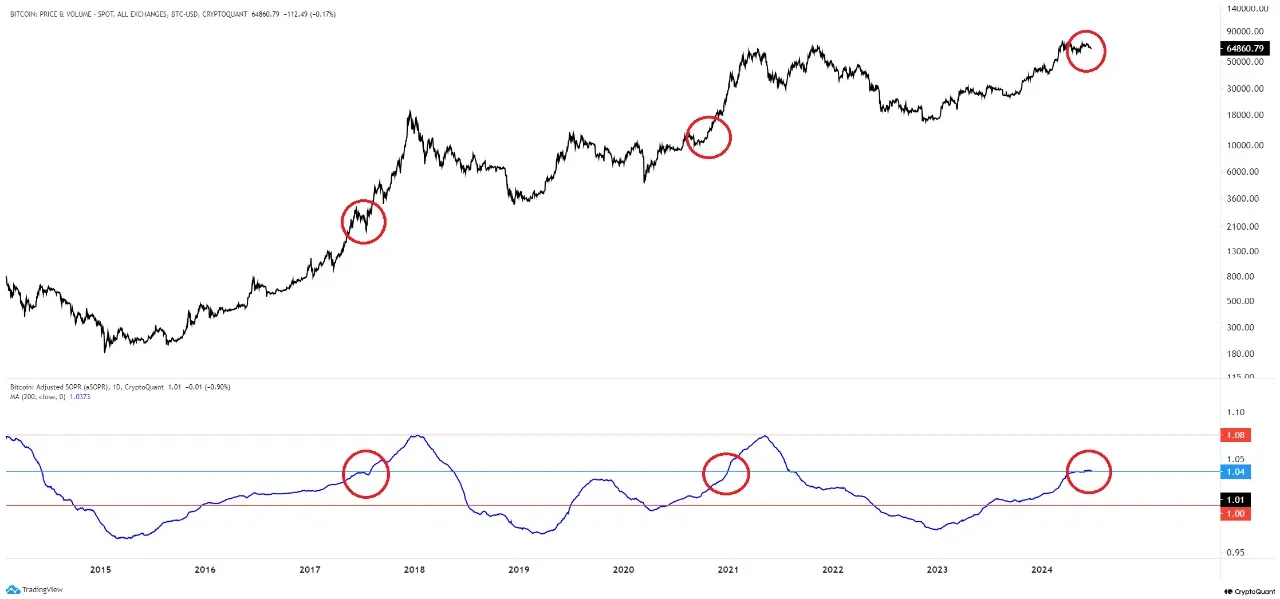
MVRV-Z and NUPL give you the big picture - aggregate snapshots of the entire network's position. aSOPR zooms in on what is happening right now. Today. This hour. It measures the average profit or loss ratio of coins that actually moved in the last 24 hours, filtering out intra-hour noise that would otherwise muddy the signal. Above 1.0 means sellers are cashing out profitably and demand is absorbing the supply without breaking a sweat. Below 1.0 means sellers are eating losses. That sounds bearish - and sometimes it is - but sustained sub-1.0 readings often signal something counterintuitive: weak hands have run dry, capitulation is nearly complete, and whoever is buying at these levels is doing it from genuine conviction rather than FOMO. That is a very different kind of buyer.
What jumped out at me when I first started studying aSOPR seriously is how it behaves around the 1.0 line during trend transitions. In bull markets, dips back to 1.0 find support because holders simply refuse to sell at breakeven - why would they, with momentum behind them? In bear markets, that same 1.0 level flips into resistance. Sellers use any rally to escape at cost, grateful just to get their money back. Same boundary. Completely opposite psychology underneath. If you track nothing else in terms of near-term sentiment, tracking that one line will teach you more than most price indicators combined.
6 Macroeconomic Context and Regulation
Bitcoin doesn't exist in a vacuum anymore. Hasn't for a while. But the speed at which it has wired itself into the broader financial system over the last two years caught even the optimists off guard. What the Fed does matters. What global M2 does matters. Risk appetite across equity and credit markets - that matters too. The self-contained ecosystem of 2015 is gone. Bitcoin went and became a highly liquid, macro-sensitive instrument, and not everybody who bought the "uncorrelated rebel asset" narrative has fully processed that yet.
Central banks are the primary external lever on crypto cycles now, and that's just the reality. Rate cuts starting December 2024, ongoing balance sheet dynamics from the Fed and ECB - these have directly influenced Bitcoin's trajectory in ways you can trace on a chart with a ruler. The correlation with S&P 500 and Nasdaq bounces around, sure, but stays moderately positive most of the time. Bitcoin rallies in risk-on environments and pulls back when capital flees to safety. I know that's genuinely annoying for people who bought into the uncorrelated safe haven pitch. It annoyed me too, for a while. But the data is what it is. The digital gold narrative reads beautifully. The correlation numbers are messier, and you have to be honest about that or you're building a thesis on sand.
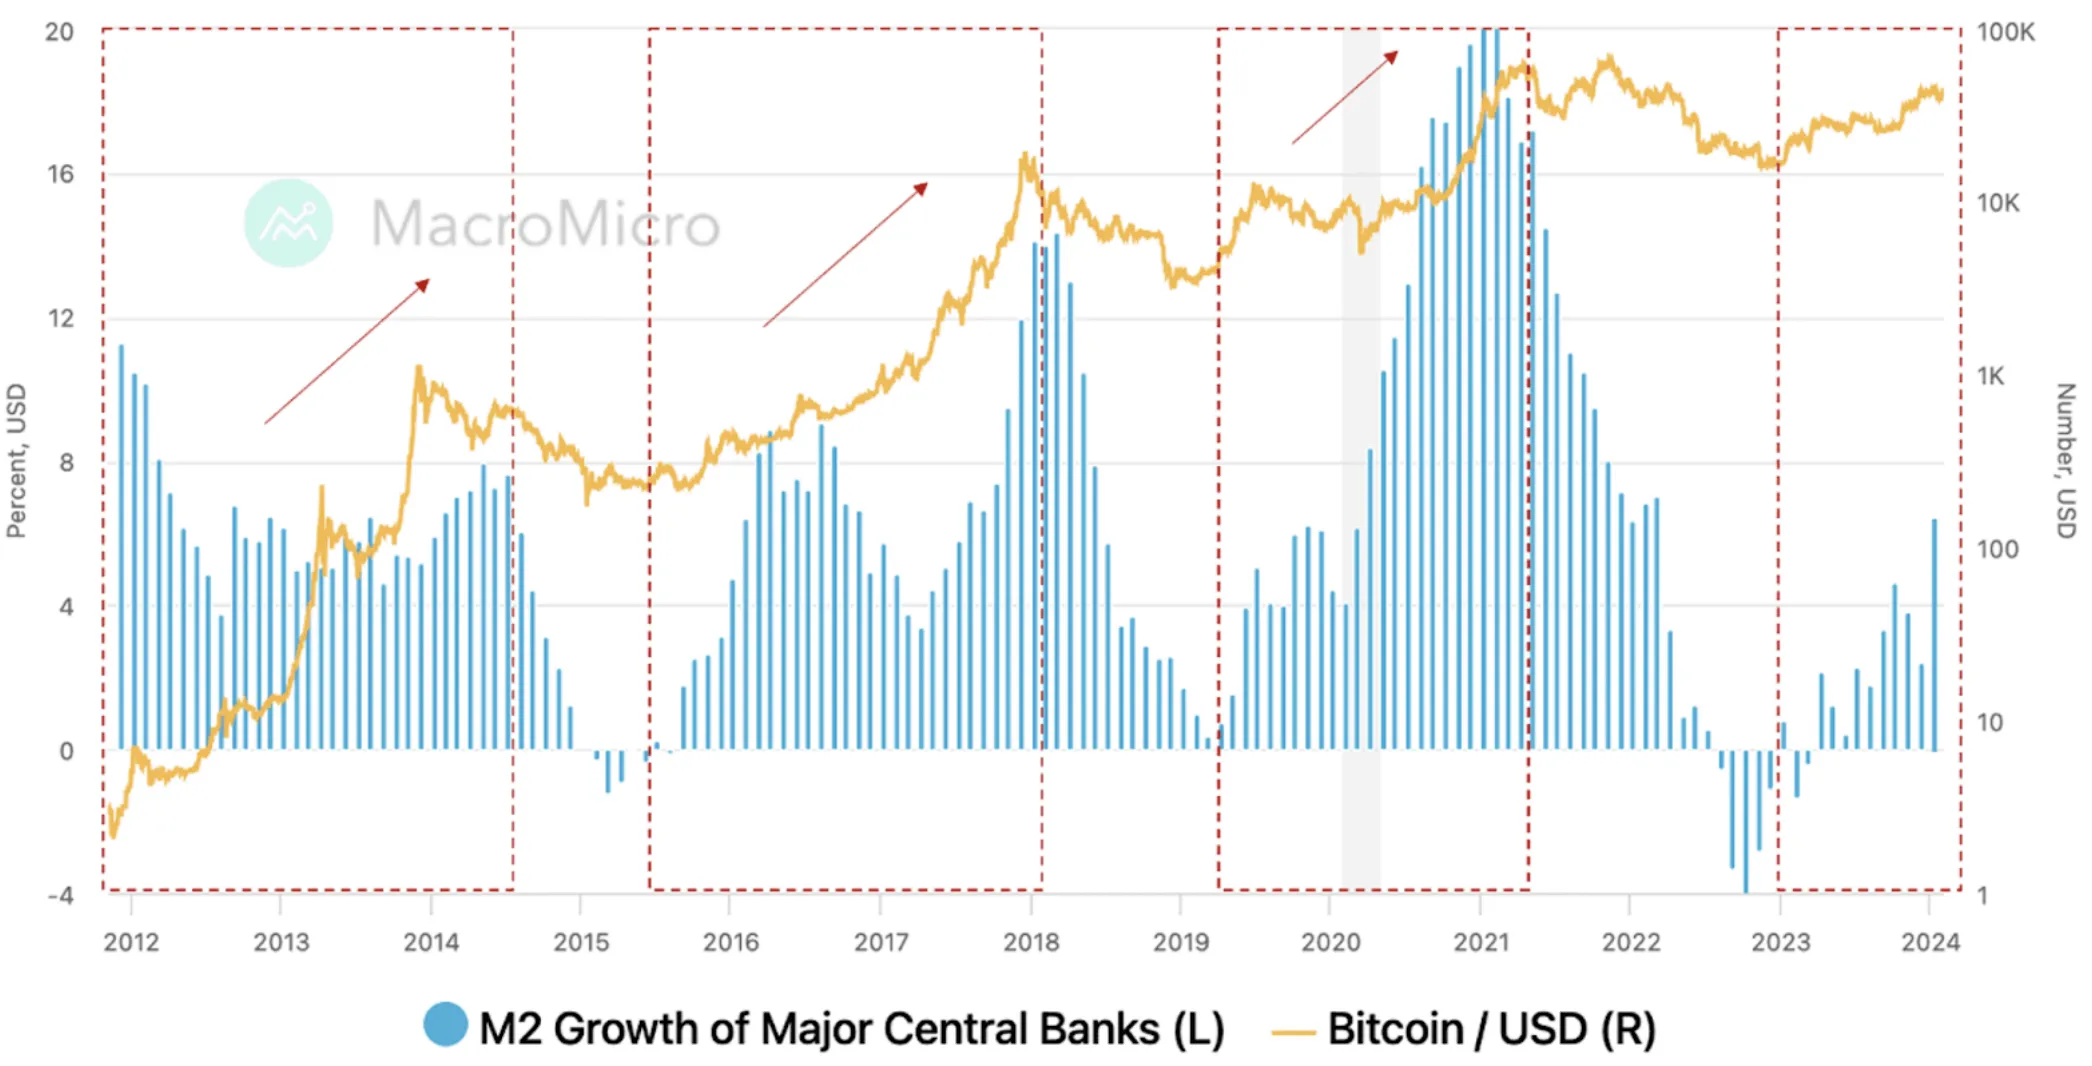
One of the cleanest macro relationships in Bitcoin's history - and I have spent more time than I'd like to admit running these regressions - is global M2 expansion. When the Fed, ECB, PBoC, and BoJ collectively open the taps, Bitcoin follows with significant upward moves. The inverse holds with depressing reliability: synchronized monetary tightening has coincided with Bitcoin's worst drawdowns. Not coincidence. This is what it looks like when a borderless, maximally liquid digital asset functions as a global liquidity sponge. It soaks up excess currency when the world is getting flooded with money, and it contracts when that liquidity reverses. For medium-term positioning the M2 relationship has become arguably more reliable than any price-based framework I've seen traders get emotionally attached to.
There is a demand driver that gets almost zero coverage in Western analysis, and it has bothered me for years: currency instability in the developing world. In Turkey, Argentina, Nigeria, and across the Global South, local devaluations and capital controls have turned Bitcoin from a speculative toy into something genuinely practical. Not speculative. Practical. For people without access to stable banking or hard currency savings - and there are billions of them - Bitcoin functions as digital insurance against a monetary system that is actively incinerating their purchasing power. That use case never appears in ETF flow charts or Bloomberg terminals, which is probably why Western-centric analysts consistently underweight it. But it is structurally real. It's persistent. And if we are being honest about which demand drivers have the longest shelf life, this one might outlast them all.
The regulatory picture has clarified a lot. Not uniformly, but substantially. The U.S. pivoted from aggressive hostility toward formal oversight - the SEC, CFTC, and FinCEN are building product standards around ETFs and custody rather than trying to strangle them in the crib. The EU's MiCA framework rolled out unified licensing and investor protections across member states, which is - depending who you ask - either a tremendous achievement of bureaucratic coordination or a predictable example of Europe regulating first and innovating never. Asia remains fragmented: China's ban holds firm, Hong Kong is building its own regulated ecosystem at a completely different tempo, and everyone else in the region is somewhere in between. Net effect? Institutional participation expanded because the legal scaffolding now exists to support it. But compliance costs jumped too. Regulation is simultaneously Bitcoin's greatest legitimizing force and its most material near-term risk vector. Both of those things are true at the same time, and you have to hold them together or your analysis falls apart.
7 Forward Market Scenarios
Bitcoin's path through 2025-2026 hinges on two variables it cannot control and never could: global liquidity and regulatory direction. The structural case - constrained supply, institutional inflows through regulated channels, on-chain data screaming accumulation by strong hands - looks as solid as I've seen in any cycle. But you know what? The structural case looked solid in late 2021 too, and the market still delivered an 80% drawdown that wiped out a generation of leveraged longs. So what follows is a probability-weighted read across four scenarios. No certainty claims. I don't have a crystal ball and I'm deeply suspicious of anyone who claims to.
8 Monitoring Framework and Investment Thesis
Any Bitcoin thesis worth defending needs a monitoring framework attached to it. Not to predict price - good luck with that; smarter people than me have tried and failed - but to verify whether the underlying conditions that made your thesis plausible are still intact. The four dimensions below cover on-chain activity, macro conditions, institutional behavior, and protocol development. Any one of them alone tells you surprisingly little. Together they give you the clearest available picture of where Bitcoin actually stands at any given moment, stripped of the hype and the fear.
- Exchange inflows/outflows - selling pressure vs. accumulation
- SOPR (Spent Output Profit Ratio) - seller profitability
- Realized Cap and HODL waves - long-term holder behavior
- MVRV-Z Score - market cycle positioning
- Net outflows from exchanges preceding accumulation phases
- FOMC meetings and Federal Reserve rate decisions
- CPI, PCE, and NFP releases - inflation and employment data
- ECB and BoJ rate decisions - global liquidity signals
- Global M2 growth trend changes
- DXY (U.S. Dollar Index) movements
- Spot ETF inflows/outflows (BlackRock IBIT, Fidelity, Ark)
- Fund disclosures and corporate BTC balance sheet updates
- SEC, CFTC, and FinCEN regulatory commentary
- MiCA/ESMA implementation progress in Europe
- New ETF approvals or expansions to additional markets
- Next halving (~2028) - supply dynamics
- Taproot-related protocol developments
- Lightning Network growth (channels, liquidity, active nodes)
- BTCFi ecosystem expansion and Layer 2 adoption
- Hash rate trends and miner consolidation
Conclusion
Bitcoin in 2025 is a fundamentally different beast from what peaked at $60,000 four years ago. The infrastructure now - regulated ETFs holding close to a million coins in custody, corporate treasury programs treating BTC like a balance sheet staple, a global compliance framework that actually functions - none of that existed in prior cycles. Not at this scale. Supply side has never been tighter: annual inflation below 0.85%, over 70% of coins classified as illiquid, exchange balances sitting at five-year lows. And for the first time in Bitcoin's history, there is a persistent institutional bid that does not vanish the second someone on CNBC says something scary.
None of which makes it bulletproof. Bitcoin is still deeply macro-sensitive and will reprice hard if global liquidity turns hostile or some regulatory event forces institutional hands. The base case is still measured adoption with continued cycles - not transcendence, not the end of volatility, not "number go up forever." I think that's the right read. The structural improvements change how the drawdowns play out, soften the edges somewhat, make the recoveries faster. But they don't eliminate the cyclical nature of this market. Probably nothing will.
What the data argues against - and this is the part I keep coming back to, the thing that won't let me look away - is the thesis that Bitcoin's institutional moment is a temporary fad that will eventually correct itself back into niche obscurity. The on-chain evidence says otherwise. Accumulation patterns, sustained exchange outflows, the composition of HODL waves - coins are moving from weaker hands into stronger ones at a pace that has historically preceded extended appreciation phases. The structural case is intact. The timing? That is where every model, every framework, every analyst (including this one) runs out of road. It always is.
Bellwether Research, Market Research, October 2025