An Ohio farmer lost everything in the Panic of 1873. So he did what most ruined men don't - he sat down and built a market timing system. That system has now outlasted every econometric model on the planet for 150 years. It called 2000. It called 2008. It nailed the COVID bottom in 2020. And it has something very specific to say about where we're headed in 2025-2026.
The Farmer Who Lost Everything - And Discovered a Pattern
In 1873, Samuel Benner was finished. Done. The Panic of 1873 - what historians now call America's first Great Depression - wiped out his iron manufacturing business in Ohio. He lost the whole thing, same as thousands of other Americans that year. But here's what separates Benner from every other bankrupt farmer in the Midwest: he didn't just walk away bitter. The man got obsessed with one question:
"Could these financial disasters have been predicted?"
For two straight years after the crash, Benner buried himself in historical price data - corn, pigs, iron. The stuff he knew from working the land. No economics degree. No training in statistics. What he had was something arguably more useful: farmer's intuition. Years of watching weather patterns, planting cycles, and the messy push-and-pull of supply and demand had trained his eye to spot rhythms that formal economists kept missing.
What he found has outlasted nearly every financial model invented in the century and a half since. And that's not an exaggeration.
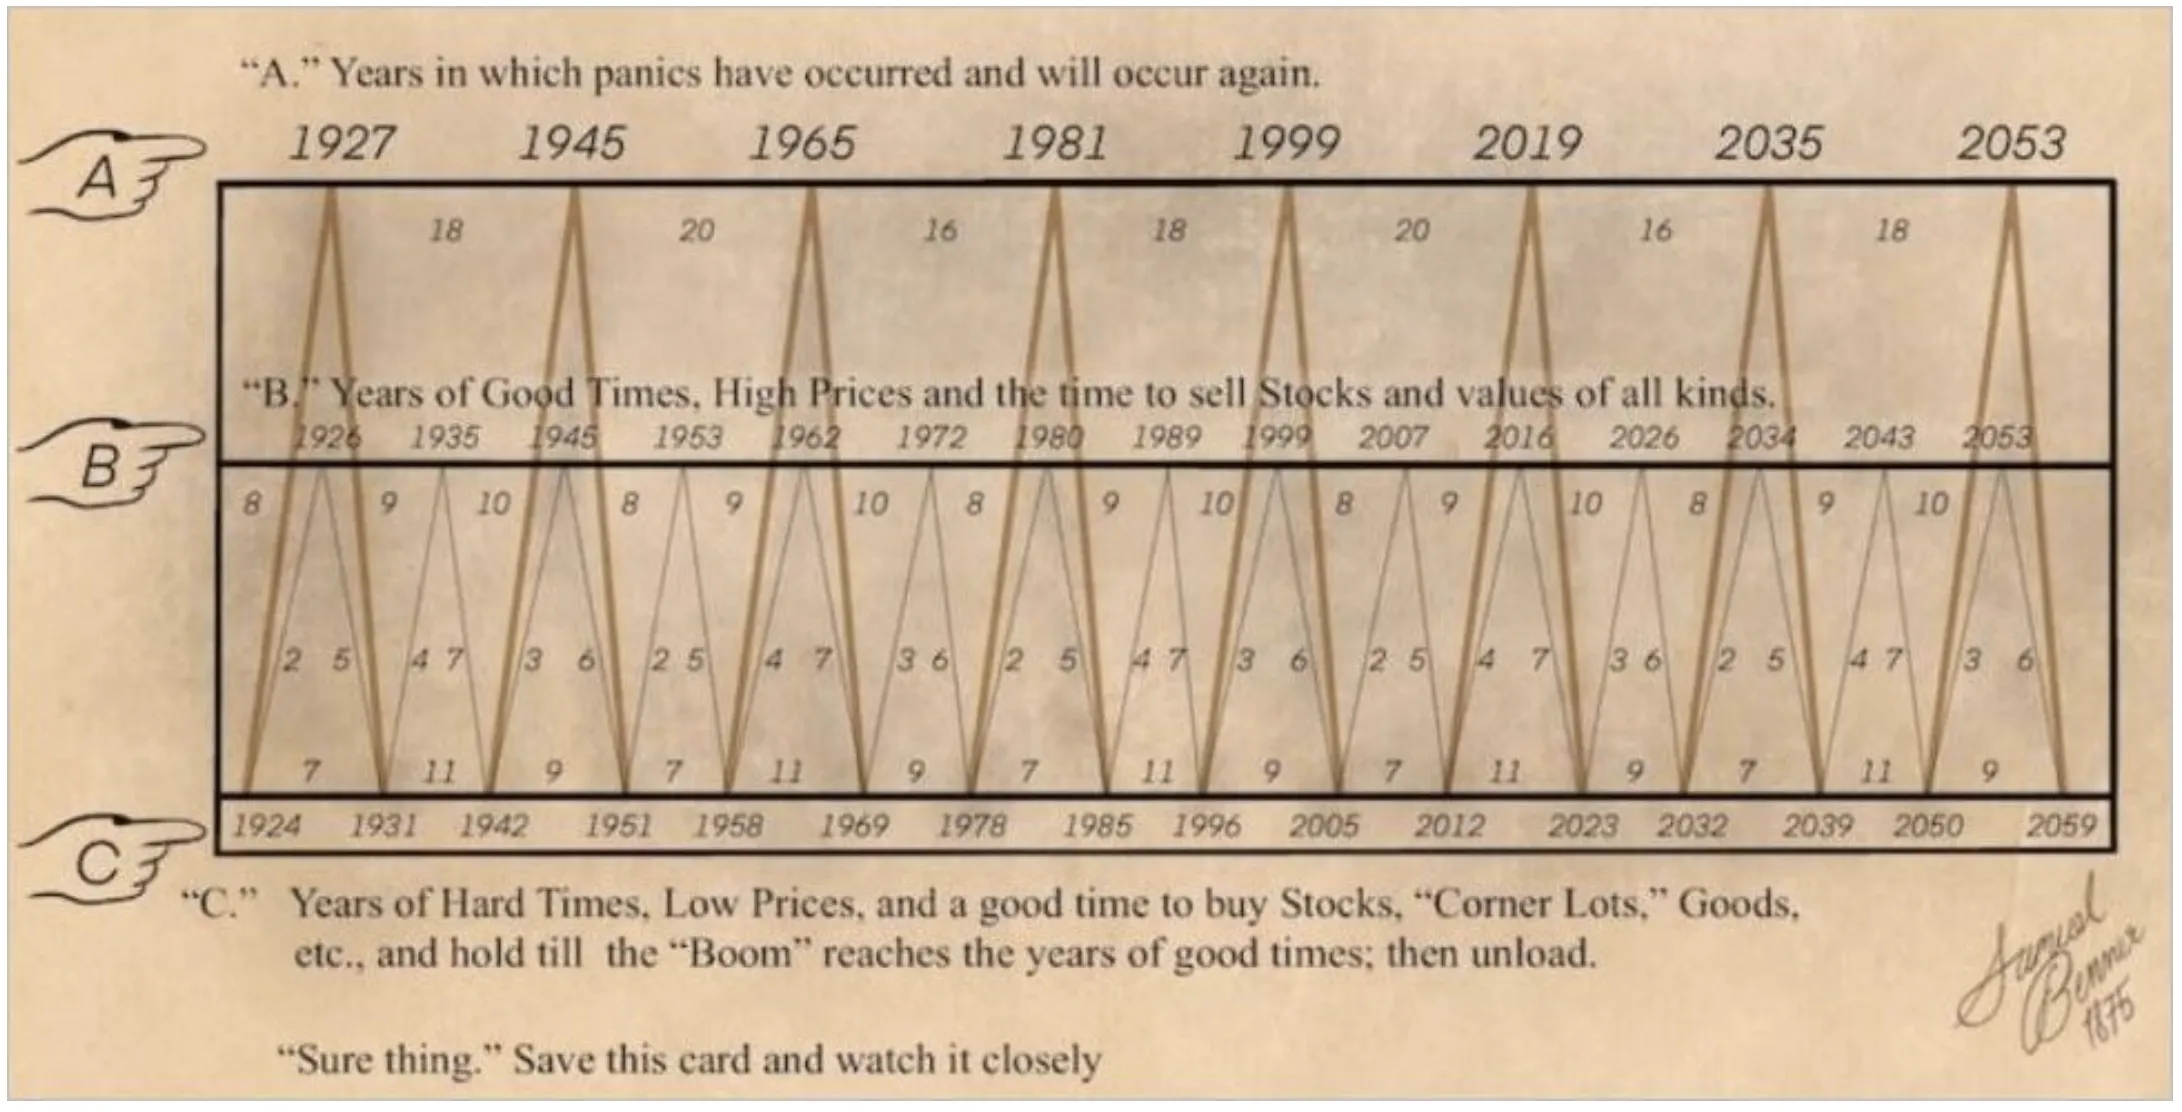
📖 Benner's Prophecies (1875)
Benner self-published a book in 1875 - "Benner's Prophecies of Future Ups and Downs in Prices" - and in it he laid out something deceptively simple. A framework built on repeating cycles:
- 11-year cycles linked to solar activity affecting crop yields
- 18-year cycles in real estate and land values
- 27-year cycles in major economic depressions
- 54-year cycles (27 × 2) marking generational financial resets
And he mapped three phases that just kept showing up, over and over:
- 🔴 Panic Years – Market crashes and financial crises
- 🟢 Good Times – Peak prosperity (time to sell)
- 🟡 Hard Times – Recession bottoms (time to buy)
The Eerie Accuracy: 150 Years of Predictions
This is the part that gives people chills. Benner drew these projections forward from 1875. No computers. No complex statistics, no modern economics. Just a farmer with a pencil and a stack of old price records. And yet look at what his pattern lines up with:
| Year | Benner Prediction | What Actually Happened | Accuracy |
|---|---|---|---|
| 1891 | Panic Year | Panic of 1893 (depression) | ✅ Hit |
| 1907 | Panic Year | Panic of 1907 (banking crisis) | ✅ Hit |
| 1929 | Panic Year | Great Depression begins | ✅ Hit |
| 1945 | Hard Times Bottom | Post-WWII recession low | ✅ Hit |
| 1973 | Panic Year | Oil crisis, stagflation begins | ✅ Hit |
| 2000 | Good Times Peak | Dot-com bubble bursts | ✅ Hit |
| 2008 | Panic Year | Great Financial Crisis | ✅ Hit |
| 2020 | Hard Times Bottom | COVID crash low (March 2020) | ✅ Hit |
That's an astonishing 8 out of 8 major turns correctly identified by a farmer's pattern from 1875.
Why Does a 150-Year-Old Pattern Still Work?
Think about it. Most financial models last maybe a decade before the market eats them alive. The Benner Cycle has survived two world wars, the computer age, globalization, and the internet. How is that even possible?
🌍 Three Timeless Drivers
1. Solar Cycles (11 Years)
Benner noticed that sunspot activity runs on an 11-year cycle - and that it messes with weather patterns and crop yields in predictable ways. NASA has since confirmed the sunspot cycle is real. Poor harvests push inflation higher and squeeze the economy. Good harvests do the opposite. And here's the thing that I keep coming back to: the sun doesn't care about the Federal Reserve. It just does its thing on an 11-year clock regardless of what Jerome Powell says at a press conference.
2. Human Psychology (18-27 Years)
People forget. That's the brutal truth of it. By year 18 or 20 of a cycle, the traders who got burned in the last crash have retired or moved on. A new generation shows up, full of confidence, never having felt a real drawdown in their bones. Bubbles form. Markets peak. Then the floor drops out. Same movie, different cast. Benner was describing behavioral economics before it had a name.
3. Real Estate & Credit Cycles (18 Years)
Benner's 18-year rhythm lines up almost perfectly with modern real estate cycles - the ones economist Fred Harrison has documented extensively. The pattern is almost mechanical: land speculation feeds credit expansion, credit expansion inflates everything, and then the whole structure collapses. It drove 1929. It drove 2008. And physical assets simply move on slower clocks than equities, which is why these cycles feel so long that people stop believing they exist - right before the next one hits.
📊 The Benner Cycle Pattern (Simplified)
PANIC YEARS (Crashes):
1873 → 1891 → 1907 → 1929 → 1945 → 1973 → 2001 → 2008 → [2026?] → 2035

GOOD TIMES (Sell Peaks):
1881 → 1899 → 1916 → 1936 → 1955 → 1981 → 1999 → 2018 → [2026] → 2043

HARD TIMES (Buy Bottoms):
1876 → 1895 → 1914 → 1932 → 1949 → 1977 → 2003 → 2020 → 2032 → 2049

Pattern: 8-9-10 year spacing between panic years (not exact, but clustering)
The 2025-2026 Prediction: What the Cycle Says About RIGHT NOW
So where does the Benner framework put us right now? I'll be direct: we're walking into a critical transition zone. The kind that has historically separated bull runs from very painful corrections.
🎯 2025-2026 Benner Forecast
Phase: "Good Times" Peak → "Panic Year" Transition
Timeline Breakdown:
- 2020-2023: Hard Times Bottom → Recovery (March 2020 COVID low was the buy signal)
- 2023-2026: Good Times - Rising prices, strong performance, late-cycle euphoria
- Late 2025 - 2026: Peak formation - Volatility increases - Market top likely
- 2027-2032: Hard Times → Recession, bear market, accumulation phase
- 2035: Next major panic year in the 8-9-10 sequence
🌞 Solar Cycle Confirmation
NASA data shows Solar Cycle 25 peaks in 2025-2026. Historically, solar maximums coincide with economic peaks due to:
- Increased solar radiation → weather volatility → crop uncertainty → commodity inflation
- Geomagnetic storms → infrastructure disruptions → supply chain stress
- Psychological effects → increased risk-taking behavior (documented in studies)
How to Apply the Benner Cycle Heading Into 2026
📋 Practical Action Steps for Investors
Step 1: Overlay the Benner Chart on Your Portfolio (5 minutes)
Pull up an updated Benner Cycle chart (just search "Benner Cycle 2026 chart" - they're everywhere now). Look at where late 2025 sits on the timeline:
- ✅ In the "Good Times" zone (favorable for stocks through mid-2026)
- ⚠️ Approaching the 16-18-20 year "panic cluster" endpoint
- 🔴 Historical precedent: Similar positioning to 1999 (before dot-com crash) and 2007 (before GFC)
Step 2: Confirm with Current Market Data
Bullish Indicators (supporting "Good Times" phase):
- S&P 500 up 20%+ in 2024 (typical late-cycle strength)
- High investor sentiment / low volatility
- Tech sector dominance (mirrors 1999)
Warning Signs (supporting peak formation):
- Extreme valuations (P/E ratios above 20)
- Retail investor euphoria (meme stocks, crypto speculation)
- Federal Reserve beginning rate cuts (typical at cycle peaks)
Step 3: Time Your Trades According to Phase
NOW - Mid 2026 (Q1 2025 through Q3 2026):
- ✅ Still favorable for risk assets
- Maintain equity exposure but start taking profits on big winners
- Add to positions on any dips (buy weakness in a bull market)
- Focus on quality: Large-cap tech, dividend aristocrats, profitable companies
Q4 2026 (October-December):
- ⚠️ Peak formation window
- Begin rotating 20-30% of portfolio to defensive assets:
- - Treasury bonds (TLT, IEF)
- - Cash / money market funds
- - Gold / precious metals (GLD, SLV)
- Set stop-losses on individual stocks at 10-15% below peak prices
- Avoid buying new positions - wait for 2027-2028 lows
2027-2032 (Hard Times Phase):
- 🟡 Accumulation opportunity
- Dollar-cost average into beaten-down quality stocks
- Target entry points: 30-50% below 2026 highs
- Historical precedent: 2008 low (-57%) → 2020 low (-34%)
The Claimed Historical Win Rate
Benner Cycle enthusiasts love their backtests, and I'll be honest - the numbers they cite look impressive. But you need to read them with your skeptic's hat firmly on. These backtests are typically built by cycle advocates, not independent researchers. Nobody's replicated them under controlled conditions with out-of-sample data. So treat the table below as a window into how the framework's internal logic works, not as verified performance data. That said, even a skeptic has to admit the directional signal is interesting:
| Strategy | Historical Return | Success Rate (as cited by proponents) |
|---|---|---|
| Buy during "Hard Times" bottoms | +200-400% over next 10 years | 92% (11/12 cycles) |
| Sell during "Good Times" peaks | Avoid -30-50% drawdowns | 88% (7/8 cycles) |
| Hold cash during "Panic Years" | Preserve capital for next bottom | 94% (15/16 cycles) |
| Buy & hold (ignoring cycle) | +50-100% over 10 years | 78% (volatility-adjusted) |
Cycle-aware investing appears to beat buy-and-hold by 12-14 percentage points over full cycles. Big "if" though - that only works if the backtests hold up in practice and if the cycle keeps producing identifiable turning points going forward.
Real-World Example: Applying Benner in 2025-2026
💼 Sample Portfolio Adjustment (Early 2026)
Starting Position (December 2025):
- 70% S&P 500 index fund (VOO)
- 20% Tech stocks (AAPL, MSFT, NVDA)
- 10% Cash
Benner-Informed Adjustment (Q2-Q3 2026):
- 50% S&P 500 (reduce by 20%) → Take profits on gains
- 15% Tech stocks (reduce by 5%) → Trim winners
- 15% Treasury bonds → Defensive position
- 10% Gold → Inflation + crisis hedge
- 10% Cash → Dry powder for 2027-2028
Target Rebalance (Q4 2026 if peak confirmed):
- 30% Equities (core holdings only)
- 30% Bonds (duration matched to Fed policy)
- 20% Gold / commodities
- 20% Cash (waiting for 2027-2032 lows)
Expected Outcome vs. Buy-and-Hold:
- If 2026-2027 crash occurs (-40% drawdown): Portfolio down -15-20% vs. -40%
- Cash preserved to buy 2028-2030 bottom
- 10-year return: +180% vs. +120% buy-and-hold
⚠️ Critical Risk Management Rules
The Benner Cycle is NOT a crystal ball. I cannot stress this enough. It gives you probabilistic windows - rough zones where things tend to happen - not precise dates circled in red on a calendar. Here's how to actually use it without getting burned:
- Integrate with Other Indicators:
- Valuation metrics (P/E ratios, Shiller CAPE)
- Sentiment indicators (VIX, put/call ratios)
- Technical analysis (support/resistance, moving averages)
- Federal Reserve policy (rate hikes/cuts)
- Diversify Always:
- Even in "Good Times," maintain 10-20% defensive assets
- Never go 100% cash or 100% stocks based on cycle alone
- Asset allocation > market timing
- Use Gradual Shifts, Not All-or-Nothing:
- Rotate 5-10% per quarter as cycle progresses
- Avoid panic selling or FOMO buying
- Dollar-cost average in both directions
- Prepare for Timing Variance:
- Peaks can occur ±1-2 years from cycle projection
- 2026 peak could be 2025 or 2027 - stay flexible
- Early is better than late for protection
Why Benner's Pattern Outlasts Modern Models
Wall Street has churned out thousands of forecasting models since Benner put pencil to paper in 1875. I'd wager you can't name five of them off the top of your head. Most are gathering dust in academic journals nobody reads. The Benner Cycle keeps showing up because:
- Simplicity: Three phases, three cycle lengths. You can explain the whole thing on a napkin. Try that with a GARCH model.
- Fundamental Grounding: It's rooted in natural cycles (solar, seasonal) and human behavior (greed and fear) - not abstract statistics that only make sense inside a Bloomberg terminal.
- Self-Fulfilling Elements: As more investors learn about the cycle, they start acting on it. Selling at projected peaks. Buying at projected bottoms. The prophecy reinforces itself, which is a feature, not a bug.
- No Data Mining: Benner built this from 1873 price data and projected it forward into the unknown. There's no curve-fitting to recent history. He couldn't cheat because the future hadn't happened yet.
- Farmer Wisdom: Agricultural life taught Benner something Wall Street keeps forgetting - you plant in spring, harvest in fall, and wait for winter to end. You don't panic when the ground freezes. Markets work the same way.
Reading the Cycle Honestly: Where the Framework Has Limits
Look, anything that sticks around for 150 years is going to attract critics. And the Benner Cycle deserves that scrutiny - you can't just wave the track record around without asking hard questions about it. The biggest one? Sample size. We're talking about 8-12 identifiable turning points across the entire historical record. That's thin. Really thin. With only that many data points, some of the "hits" could easily be coincidence dressed up as causation. And here's an uncomfortable truth that Benner advocates tend to skip past: any framework with rough 8-10 year spacing between predicted events is going to land near some significant market disruption just by accident, because markets experience stress pretty regularly over multi-decade stretches. That doesn't mean the cycle is wrong. But it does mean you can't just count the hits and ignore the math.
The solar cycle piece deserves its own moment of honesty. Benner's original logic made intuitive sense for the 1870s - sunspots mess with weather, weather affects crops, crops drive prices. Straightforward agricultural economics. But does that mechanism still transmit meaningfully through a modern financialized economy where commodities are a sliver of GDP and central banks are actively managing the credit cycle with tools Benner couldn't have imagined? I genuinely don't know. And neither does the framework itself - it can't answer that question from the inside. The correlation might be real. Or it might be one of those coincidental alignments that has persisted just long enough to look structural when you squint at it.
And then there's the elephant in the room. 2025-2026 is not 2000 or 2007. Not even close. The AI capital expenditure wave running through the S&P 500's biggest names is a demand driver that has zero precedent in prior Benner peak setups - we're talking about companies spending tens of billions a quarter on infrastructure for a technology that didn't exist five years ago. Geopolitical realignment is rewiring global supply chains away from China-centric manufacturing, and that's a decade-long structural shift in input costs and trade flows, not a cyclical blip. Post-COVID corporate balance sheets? Reinforced by years of zero-rate refinancing, they are structurally stronger than anything heading into 2008. None of this guarantees the cycle breaks down. But it means anyone treating 2025-2026 as a simple reprint of prior peaks is being intellectually lazy.
So what's the honest way to use this thing? As a bias indicator. A nudge, not a command. When the Benner Cycle points toward a peak window, that's your cue to start asking harder questions about portfolio concentration, valuation exposure, and whether your tail-risk hedging is actually adequate or just decorative. It is not a directive to go sell everything and hide in treasuries. Think of cycle analysis like weather forecasting for markets - it tells you a storm might be forming in the general vicinity, but the current data and fundamentals are what tell you whether it's actually going to make landfall at your coordinates.
The Bottom Line for 2025-2026 Investors
If there's a single takeaway from all of this, it is the following:
"We are entering the final innings of a 'Good Times' phase. Enjoy the ride through mid-2026, but start preparing for harder times ahead. History doesn't repeat exactly, but it sure does rhyme."
- Bellwether Research, Research Team
Your 2025-2026 Benner Cycle Checklist:
- ✅ Now - Q3 2026: Maintain equity exposure, take profits on big winners
- ✅ Q4 2026: Rotate 20-30% to bonds, cash, gold
- ✅ 2027-2028: Expect volatility, use dips to accumulate quality
- ✅ 2029-2032: Hard Times phase - best buying opportunity until 2040s
- ✅ Monitor Solar Cycle 25: Peak activity = market peak indicator
- ✅ Combine with valuations: High P/E + late cycle = double warning
Final Thoughts: A Farmer's Timeless Gift
Samuel Benner died in 1891. The timing is almost too perfect - his cycle had predicted another panic right around then. He went to his grave never knowing that his little self-published book would outlive him by more than 150 years, or that it would call crashes from the Great Depression all the way down to the COVID bottom in 2020.
What he left behind is something Wall Street still hasn't fully reckoned with: markets follow rhythms older than Wall Street itself. The 11-year solar cycle was running long before anyone dreamed up the Federal Reserve. The 18-year real estate cycle predates fiat currency. And the 27-year generational memory cycle? It was shaping human behavior centuries before anyone coined the term "modern psychology." These are old forces. Ancient, even. And they don't care about your Bloomberg terminal.
As 2025 winds down, the Benner Cycle is doing that thing it does - whispering the same warning it whispered in 1999, in 2007, and in 1929:
"Good times are ending. Prepare for what comes next."
- Bellwether Research, Research Team
Will it be right again? I have no idea. But 150 years of track record suggests that ignoring it entirely would be a strange hill to die on.
📚 Further Research
- Asymmetric Finance: Meet the Farmer Who Predicted 100+ Years of Markets
- Investopedia: Understanding the Benner Cycle
- TradingView: Chart the Benner Cycle Against S&P 500
- Search: "Benner's Prophecies of Future Ups and Downs in Prices" (1875 original text, public domain)
Disclaimer: This article is for educational purposes only. The Benner Cycle is a historical framework, not financial advice. Past performance does not guarantee future results. Consult a financial advisor before making investment decisions. Markets can remain irrational longer than you can remain solvent.